RBS 2009 Annual Report Download - page 295
Download and view the complete annual report
Please find page 295 of the 2009 RBS annual report below. You can navigate through the pages in the report by either clicking on the pages listed below, or by using the keyword search tool below to find specific information within the annual report.-
 1
1 -
2
-
3
-
4
-
5
-
6
-
7
-
8
-
9
-
10
-
11
-
12
-
13
-
14
-
15
-
16
-
17
-
18
-
19
-
20
-
21
-
22
-
23
-
24
-
25
-
26
-
27
-
28
-
29
-
30
-
31
-
32
-
33
-
34
-
35
-
36
-
37
-
38
-
39
-
40
-
41
-
42
-
43
-
44
-
45
-
46
-
47
-
48
-
49
-
50
-
51
-
52
-
53
-
54
-
55
-
56
-
57
-
58
-
59
-
60
-
61
-
62
-
63
-
64
-
65
-
66
-
67
-
68
-
69
-
70
-
71
-
72
-
73
-
74
-
75
-
76
-
77
-
78
-
79
-
80
-
81
-
82
-
83
-
84
-
85
-
86
-
87
-
88
-
89
-
90
-
91
-
92
-
93
-
94
-
95
-
96
-
97
-
98
-
99
-
100
-
101
-
102
-
103
-
104
-
105
-
106
-
107
-
108
-
109
-
110
-
111
-
112
-
113
-
114
-
115
-
116
-
117
-
118
-
119
-
120
-
121
-
122
-
123
-
124
-
125
-
126
-
127
-
128
-
129
-
130
-
131
-
132
-
133
-
134
-
135
-
136
-
137
-
138
-
139
-
140
-
141
-
142
-
143
-
144
-
145
-
146
-
147
-
148
-
149
-
150
-
151
-
152
-
153
-
154
-
155
-
156
-
157
-
158
-
159
-
160
-
161
-
162
-
163
-
164
-
165
-
166
-
167
-
168
-
169
-
170
-
171
-
172
-
173
-
174
-
175
-
176
-
177
-
178
-
179
-
180
-
181
-
182
-
183
-
184
-
185
-
186
-
187
-
188
-
189
-
190
-
191
-
192
-
193
-
194
-
195
-
196
-
197
-
198
-
199
-
200
-
201
-
202
-
203
-
204
-
205
-
206
-
207
-
208
-
209
-
210
-
211
-
212
-
213
-
214
-
215
-
216
-
217
-
218
-
219
-
220
-
221
-
222
-
223
-
224
-
225
-
226
-
227
-
228
-
229
-
230
-
231
-
232
-
233
-
234
-
235
-
236
-
237
-
238
-
239
-
240
-
241
-
242
-
243
-
244
-
245
-
246
-
247
-
248
-
249
-
250
-
251
-
252
-
253
-
254
-
255
-
256
-
257
-
258
-
259
-
260
-
261
-
262
-
263
-
264
-
265
-
266
-
267
-
268
-
269
-
270
-
271
-
272
-
273
-
274
-
275
-
276
-
277
-
278
-
279
-
280
-
281
-
282
-
283
-
284
-
 285
285 -
 286
286 -
 287
287 -
 288
288 -
 289
289 -
 290
290 -
 291
291 -
 292
292 -
 293
293 -
 294
294 -
 295
295 -
 296
296 -
 297
297 -
 298
298 -
 299
299 -
 300
300 -
 301
301 -
 302
302 -
 303
303 -
 304
304 -
 305
305 -
306
-
307
-
308
-
309
-
310
-
311
-
312
-
313
-
314
-
315
-
316
-
317
-
318
-
319
-
320
-
321
-
322
-
323
-
324
-
325
-
326
-
327
-
328
-
329
-
330
-
331
-
332
-
333
-
334
-
335
-
336
-
337
-
338
-
339
-
340
-
341
-
342
-
343
-
344
-
345
-
346
-
347
-
348
-
349
-
350
-
351
-
352
-
353
-
354
-
355
-
356
-
357
-
358
-
359
-
360
-
361
-
362
-
363
-
364
-
365
-
366
-
367
-
368
-
369
-
370
-
371
-
372
-
373
-
374
-
375
-
376
-
377
-
378
-
379
-
380
-
381
-
382
-
383
-
384
-
385
-
386
-
387
-
388
-
389
-
390
 |
 |

Financial statements
Notes on the accounts
293RBS Group Annual Report and Accounts 2009
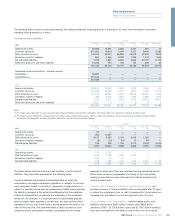
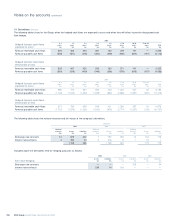
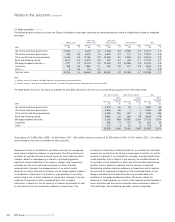
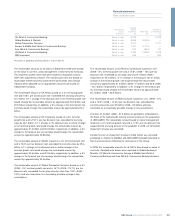
The following tables show an analysis of impaired financial assets.
Group
2009 2008 2007
Carrying Carrying Carrying
Cost Provision value Cost Provision value Cost Provision value
£m £m £m £m £m £m £m £m £m
Loans and receivables
Loans and advances to banks (1) 206 157 49 129 127 2 25 3 22
Loans and advances to customers (2) 34,801 14,050 20,751 19,350 8,945 10,405 10,337 5,399 4,938
35,007 14,207 20,800 19,479 9,072 10,407 10,362 5,402 4,960
Group
Carrying Carrying Carrying
Value Value Value
2009 2008 2007
£m £m £m
Available-for-sale
Debt securities 758 618 1
Equity shares 180 87 72
938 705 73
Notes:
(1) Impairment provisions individually assessed.
(2) Impairment provisions individually assessed on balances of £24,540 million (2008 – £11,313 million; 2007 – £3,178 million).
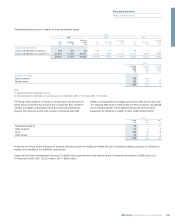
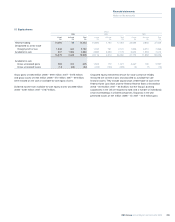
Group
2009 2008 2007
£m £m £m
Residential property 52 41 32
Other property 110 68
Cash 283 59 18
Other assets 42 30 5
487 136 63
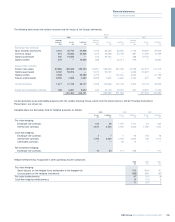
In general, the Group seeks to dispose of property and other assets not readily convertible into cash obtained by taking possession of collateral as
rapidly as the market for the individual asset permits.
Loans that have been renegotiated in the past 12 months that would otherwise have been past due or impaired amounted to £2,698 million as at
31 December 2009 (2008 – £2,637 million; 2007 – £930 million).
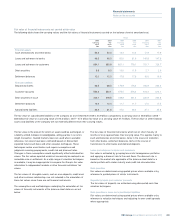
The Group holds collateral in respect of certain loans and advances to
banks and to customers that are past due or impaired. Such collateral
includes mortgages over property (both personal and commercial);
charges over business assets such as plant, inventories and trade
debtors; and guarantees of lending from parties other than the borrower.
The following table shows financial and non-financial assets, recognised
on the Group's balance sheet, obtained during the year by taking
possession of collateral or calling on other credit enhancements.