RBS 2009 Annual Report Download - page 379
Download and view the complete annual report
Please find page 379 of the 2009 RBS annual report below. You can navigate through the pages in the report by either clicking on the pages listed below, or by using the keyword search tool below to find specific information within the annual report.-
 1
1 -
2
-
3
-
4
-
5
-
6
-
7
-
8
-
9
-
10
-
11
-
12
-
13
-
14
-
15
-
16
-
17
-
18
-
19
-
20
-
21
-
22
-
23
-
24
-
25
-
26
-
27
-
28
-
29
-
30
-
31
-
32
-
33
-
34
-
35
-
36
-
37
-
38
-
39
-
40
-
41
-
42
-
43
-
44
-
45
-
46
-
47
-
48
-
49
-
50
-
51
-
52
-
53
-
54
-
55
-
56
-
57
-
58
-
59
-
60
-
61
-
62
-
63
-
64
-
65
-
66
-
67
-
68
-
69
-
70
-
71
-
72
-
73
-
74
-
75
-
76
-
77
-
78
-
79
-
80
-
81
-
82
-
83
-
84
-
85
-
86
-
87
-
88
-
89
-
90
-
91
-
92
-
93
-
94
-
95
-
96
-
97
-
98
-
99
-
100
-
101
-
102
-
103
-
104
-
105
-
106
-
107
-
108
-
109
-
110
-
111
-
112
-
113
-
114
-
115
-
116
-
117
-
118
-
119
-
120
-
121
-
122
-
123
-
124
-
125
-
126
-
127
-
128
-
129
-
130
-
131
-
132
-
133
-
134
-
135
-
136
-
137
-
138
-
139
-
140
-
141
-
142
-
143
-
144
-
145
-
146
-
147
-
148
-
149
-
150
-
151
-
152
-
153
-
154
-
155
-
156
-
157
-
158
-
159
-
160
-
161
-
162
-
163
-
164
-
165
-
166
-
167
-
168
-
169
-
170
-
171
-
172
-
173
-
174
-
175
-
176
-
177
-
178
-
179
-
180
-
181
-
182
-
183
-
184
-
185
-
186
-
187
-
188
-
189
-
190
-
191
-
192
-
193
-
194
-
195
-
196
-
197
-
198
-
199
-
200
-
201
-
202
-
203
-
204
-
205
-
206
-
207
-
208
-
209
-
210
-
211
-
212
-
213
-
214
-
215
-
216
-
217
-
218
-
219
-
220
-
221
-
222
-
223
-
224
-
225
-
226
-
227
-
228
-
229
-
230
-
231
-
232
-
233
-
234
-
235
-
236
-
237
-
238
-
239
-
240
-
241
-
242
-
243
-
244
-
245
-
246
-
247
-
248
-
249
-
250
-
251
-
252
-
253
-
254
-
255
-
256
-
257
-
258
-
259
-
260
-
261
-
262
-
263
-
264
-
265
-
266
-
267
-
268
-
269
-
270
-
271
-
272
-
273
-
274
-
275
-
276
-
277
-
278
-
279
-
280
-
281
-
282
-
283
-
284
-
285
-
286
-
287
-
288
-
289
-
290
-
291
-
292
-
293
-
294
-
295
-
296
-
297
-
298
-
299
-
300
-
301
-
302
-
303
-
304
-
305
-
306
-
307
-
308
-
309
-
310
-
311
-
312
-
313
-
314
-
315
-
316
-
317
-
318
-
319
-
320
-
321
-
322
-
323
-
324
-
325
-
326
-
327
-
328
-
329
-
330
-
331
-
332
-
333
-
334
-
335
-
336
-
337
-
338
-
339
-
340
-
341
-
342
-
343
-
344
-
345
-
346
-
347
-
348
-
349
-
350
-
351
-
352
-
353
-
354
-
355
-
356
-
357
-
358
-
359
-
360
-
361
-
362
-
363
-
364
-
365
-
366
-
367
-
368
-
 369
369 -
 370
370 -
 371
371 -
 372
372 -
 373
373 -
 374
374 -
 375
375 -
 376
376 -
 377
377 -
 378
378 -
 379
379 -
 380
380 -
 381
381 -
 382
382 -
 383
383 -
 384
384 -
 385
385 -
 386
386 -
 387
387 -
 388
388 -
 389
389 -
390
 |
 |

Shareholder information
377RBS Group Annual Report and Accounts 2009
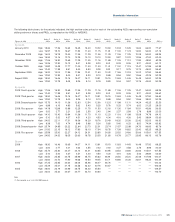
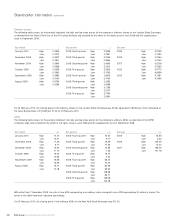
Dividend history
Preference and other non-equity dividends
2009 2008 2007 2006 2005
Subordinated Subordinated Subordinated Subordinated Subordinated
liabilities Equity liabilities Equity liabilities Equity liabilities Equity liabilities Equity
Amount per share $£$£ ££ ££ ££ ££
Non-cumulative preference shares
of US$0.01
– Series D (redeemed March 2006) — — — — 0.21 1.13
– Series E (redeemed January 2007) — — — 0.04 1.10 1.12
– Series F 1.91 1.22 1.04 0.96 1.03 1.06
– Series G (redeemed January 2007) — — — 0.04 1.00 1.02
– Series H 1.81 1.15 0.99 0.91 0.98 1.00
– Series I (redeemed March 2006) — — — — 0.20 1.10
– Series J (redeemed November 2005) — — — — — 1.06
– Series K (redeemed January 2007) — — — 0.04 1.06 1.09
– Series L 1.44 0.92 0.78 0.72 0.78 0.79
– Series M 1.60 1.02 0.89 0.80 0.87 0.88
– Series N 1.59 1.01 0.88 0.79 0.86 0.55
– Series P 1.56 0.99 0.87 0.78 0.85 0.13
– Series Q 1.69 1.07 0.94 0.84 0.53 —
– Series R 1.53 0.97 0.85 0.77 — —
– Series S 1.65 1.05 0.92 0.41 — —
– Series T 1.81 1.15 1.01 0.23 — —
– Series U 7,640 5,019 3,935 — — —
Non-cumulative convertible
preference shares of US$0.01
– Series 1 91.18 60.33 49.66 45.58 50.26 50.33
– Series 2 (redeemed March 2005) — — — — — 11.60
– Series 3 (redeemed December 2005) — — — — — 43.03
Non-cumulative convertible
preference shares of €0.01
– Series 1 (redeemed March 2005) — — — — — 11.54
Non-cumulative preference shares
of €0.01
– Series 1 79.96 49.46 46.53 39.63 37.18 41.14
– Series 2 74.36 46.00 41.79 35.52 36.22 —
– Series 3 5,052 3,125 2,782 — — —
Non-cumulative convertible
preference shares of £0.01
– Series 1 119.43 73.87 73.87 73.87 73.87 73.87
Non-cumulative preference
shares of £1
– Series 1 131.96 81.62 80.73 — — —
– Series 2 (redeemed April 2009) 88.45 54.71 ————
The Group has undertaken that, unless otherwise agreed with the European Commission, neither the company nor any of its direct or indirect
subsidiaries (excluding companies in the ABN AMRO Group) will pay external investors any dividends or coupons on existing hybrid capital
instruments (including preference shares, B shares and upper and lower tier 2 instruments) from a date starting not later than 30 April 2010 and for a
period of two years thereafter (“the deferral period”), or exercise any call rights in relation to these capital instruments between 24 November 2009
and the end of the deferral period, unless there is a legal obligation to do so. Hybrid capital instruments issued after 24 November 2009 will generally
not be subject to the restriction on dividend or coupon payments or call options.
For further information, see Note 7 on the accounts.