RBS 2009 Annual Report Download - page 169
Download and view the complete annual report
Please find page 169 of the 2009 RBS annual report below. You can navigate through the pages in the report by either clicking on the pages listed below, or by using the keyword search tool below to find specific information within the annual report.-
 1
1 -
2
-
3
-
4
-
5
-
6
-
7
-
8
-
9
-
10
-
11
-
12
-
13
-
14
-
15
-
16
-
17
-
18
-
19
-
20
-
21
-
22
-
23
-
24
-
25
-
26
-
27
-
28
-
29
-
30
-
31
-
32
-
33
-
34
-
35
-
36
-
37
-
38
-
39
-
40
-
41
-
42
-
43
-
44
-
45
-
46
-
47
-
48
-
49
-
50
-
51
-
52
-
53
-
54
-
55
-
56
-
57
-
58
-
59
-
60
-
61
-
62
-
63
-
64
-
65
-
66
-
67
-
68
-
69
-
70
-
71
-
72
-
73
-
74
-
75
-
76
-
77
-
78
-
79
-
80
-
81
-
82
-
83
-
84
-
85
-
86
-
87
-
88
-
89
-
90
-
91
-
92
-
93
-
94
-
95
-
96
-
97
-
98
-
99
-
100
-
101
-
102
-
103
-
104
-
105
-
106
-
107
-
108
-
109
-
110
-
111
-
112
-
113
-
114
-
115
-
116
-
117
-
118
-
119
-
120
-
121
-
122
-
123
-
124
-
125
-
126
-
127
-
128
-
129
-
130
-
131
-
132
-
133
-
134
-
135
-
136
-
137
-
138
-
139
-
140
-
141
-
142
-
143
-
144
-
145
-
146
-
147
-
148
-
149
-
150
-
151
-
152
-
153
-
154
-
155
-
156
-
157
-
158
-
 159
159 -
 160
160 -
 161
161 -
 162
162 -
 163
163 -
 164
164 -
 165
165 -
 166
166 -
 167
167 -
 168
168 -
 169
169 -
 170
170 -
 171
171 -
 172
172 -
 173
173 -
 174
174 -
 175
175 -
 176
176 -
 177
177 -
 178
178 -
 179
179 -
180
-
181
-
182
-
183
-
184
-
185
-
186
-
187
-
188
-
189
-
190
-
191
-
192
-
193
-
194
-
195
-
196
-
197
-
198
-
199
-
200
-
201
-
202
-
203
-
204
-
205
-
206
-
207
-
208
-
209
-
210
-
211
-
212
-
213
-
214
-
215
-
216
-
217
-
218
-
219
-
220
-
221
-
222
-
223
-
224
-
225
-
226
-
227
-
228
-
229
-
230
-
231
-
232
-
233
-
234
-
235
-
236
-
237
-
238
-
239
-
240
-
241
-
242
-
243
-
244
-
245
-
246
-
247
-
248
-
249
-
250
-
251
-
252
-
253
-
254
-
255
-
256
-
257
-
258
-
259
-
260
-
261
-
262
-
263
-
264
-
265
-
266
-
267
-
268
-
269
-
270
-
271
-
272
-
273
-
274
-
275
-
276
-
277
-
278
-
279
-
280
-
281
-
282
-
283
-
284
-
285
-
286
-
287
-
288
-
289
-
290
-
291
-
292
-
293
-
294
-
295
-
296
-
297
-
298
-
299
-
300
-
301
-
302
-
303
-
304
-
305
-
306
-
307
-
308
-
309
-
310
-
311
-
312
-
313
-
314
-
315
-
316
-
317
-
318
-
319
-
320
-
321
-
322
-
323
-
324
-
325
-
326
-
327
-
328
-
329
-
330
-
331
-
332
-
333
-
334
-
335
-
336
-
337
-
338
-
339
-
340
-
341
-
342
-
343
-
344
-
345
-
346
-
347
-
348
-
349
-
350
-
351
-
352
-
353
-
354
-
355
-
356
-
357
-
358
-
359
-
360
-
361
-
362
-
363
-
364
-
365
-
366
-
367
-
368
-
369
-
370
-
371
-
372
-
373
-
374
-
375
-
376
-
377
-
378
-
379
-
380
-
381
-
382
-
383
-
384
-
385
-
386
-
387
-
388
-
389
-
390
 |
 |

Business review
Risk, capital and liquidity management
167RBS Group Annual Report and Accounts 2009
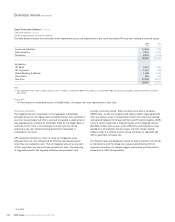
Currency risk
The Group does not maintain material non-trading open currency
positions other than the structural foreign currency translation exposures
arising from its investments in foreign subsidiaries and associated
undertakings and their related currency funding. The Group’s policy in
relation to structural positions is to match fund the structural foreign
currency exposure arising from net asset value, including goodwill in
foreign subsidiaries, equity accounted investments and branches,
except where doing so would materially increase the sensitivity of either
the Group’s or the subsidiary’s regulatory capital ratios to currency
movements. The policy requires structural foreign exchange positions to
be reviewed regularly by the Group Asset and Liability Committee.
Foreign exchange differences arising on the translation of foreign
operations are recognised directly in equity, together with the effective
portion of foreign exchange differences arising on hedging instruments.
Equity classification of foreign currency denominated preference share
issuances means that these shares are recorded on the balance sheet
at historical cost. Consequently, these share issuances have the effect
of increasing the Group’s structural foreign currency position.
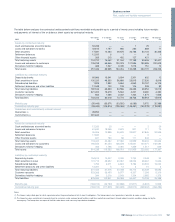
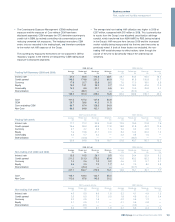
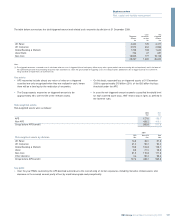
The tables below set out the Group’s structural foreign currency
exposures:
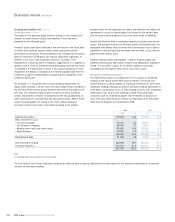
Key points
•Retranslation gains and losses on the Group’s net investment in
operations together with those on instruments hedging these
investments are recognised directly in equity.
•Changes in foreign currency exchange rates will affect equity in
proportion to the structural foreign currency exposure. A 5%
strengthening in foreign currencies against sterling would result in a
gain of £980 million (2008 – £1,010 million) recognised in equity,
while a 5% weakening in foreign currencies would result in a loss of
£880 million (2008 – £960 million) recognised in equity.
•These movements in equity would off-set retranslation effects on the
Group's foreign currency denominated RWAs, reducing the
sensitivity of the Group's Tier 1 capital ratio to movements in foreign
currency exchange rates.
Net Net Structural
assets of investments Net foreign
overseas Minority in foreign investment currency
operations interests operations hedges exposures
2009 £m £m £m £m £m
US dollar 15,589 (2) 15,591 (3,846) 11,745
Euro 21,900 13,938 7,962 (2,351) 5,611
Other non-sterling 5,706 511 5,195 (4,001) 1,194
43,195 14,447 28,748 (10,198) 18,550
2008
US dollar 17,480 (19) 17,499 (3,659) 13,840
Euro 26,943 15,431 11,512 (7,461) 4,051
Chinese Renminbi 3,928 1,898 2,030 (1,082) 948
Other non-sterling 5,088 621 4,467 (3,096) 1,371
53,439 17,931 35,508 (15,298) 20,210
2007
US dollar 14,819 303 14,516 (2,541) 11,975
Euro 46,629 28,647 17,982 (8,818) 9,164
Chinese Renminbi 2,600 — 2,600 (1,939) 661
Brazilian Real 3,755 3,755 — — —
Other non-sterling 3,905 519 3,386 (1,219) 2,167
71,708 33,224 38,484 (14,517) 23,967