RBS 2009 Annual Report Download - page 203
Download and view the complete annual report
Please find page 203 of the 2009 RBS annual report below. You can navigate through the pages in the report by either clicking on the pages listed below, or by using the keyword search tool below to find specific information within the annual report.-
 1
1 -
2
-
3
-
4
-
5
-
6
-
7
-
8
-
9
-
10
-
11
-
12
-
13
-
14
-
15
-
16
-
17
-
18
-
19
-
20
-
21
-
22
-
23
-
24
-
25
-
26
-
27
-
28
-
29
-
30
-
31
-
32
-
33
-
34
-
35
-
36
-
37
-
38
-
39
-
40
-
41
-
42
-
43
-
44
-
45
-
46
-
47
-
48
-
49
-
50
-
51
-
52
-
53
-
54
-
55
-
56
-
57
-
58
-
59
-
60
-
61
-
62
-
63
-
64
-
65
-
66
-
67
-
68
-
69
-
70
-
71
-
72
-
73
-
74
-
75
-
76
-
77
-
78
-
79
-
80
-
81
-
82
-
83
-
84
-
85
-
86
-
87
-
88
-
89
-
90
-
91
-
92
-
93
-
94
-
95
-
96
-
97
-
98
-
99
-
100
-
101
-
102
-
103
-
104
-
105
-
106
-
107
-
108
-
109
-
110
-
111
-
112
-
113
-
114
-
115
-
116
-
117
-
118
-
119
-
120
-
121
-
122
-
123
-
124
-
125
-
126
-
127
-
128
-
129
-
130
-
131
-
132
-
133
-
134
-
135
-
136
-
137
-
138
-
139
-
140
-
141
-
142
-
143
-
144
-
145
-
146
-
147
-
148
-
149
-
150
-
151
-
152
-
153
-
154
-
155
-
156
-
157
-
158
-
159
-
160
-
161
-
162
-
163
-
164
-
165
-
166
-
167
-
168
-
169
-
170
-
171
-
172
-
173
-
174
-
175
-
176
-
177
-
178
-
179
-
180
-
181
-
182
-
183
-
184
-
185
-
186
-
187
-
188
-
189
-
190
-
191
-
192
-
 193
193 -
 194
194 -
 195
195 -
 196
196 -
 197
197 -
 198
198 -
 199
199 -
 200
200 -
 201
201 -
 202
202 -
 203
203 -
 204
204 -
 205
205 -
 206
206 -
 207
207 -
 208
208 -
 209
209 -
 210
210 -
 211
211 -
 212
212 -
 213
213 -
214
-
215
-
216
-
217
-
218
-
219
-
220
-
221
-
222
-
223
-
224
-
225
-
226
-
227
-
228
-
229
-
230
-
231
-
232
-
233
-
234
-
235
-
236
-
237
-
238
-
239
-
240
-
241
-
242
-
243
-
244
-
245
-
246
-
247
-
248
-
249
-
250
-
251
-
252
-
253
-
254
-
255
-
256
-
257
-
258
-
259
-
260
-
261
-
262
-
263
-
264
-
265
-
266
-
267
-
268
-
269
-
270
-
271
-
272
-
273
-
274
-
275
-
276
-
277
-
278
-
279
-
280
-
281
-
282
-
283
-
284
-
285
-
286
-
287
-
288
-
289
-
290
-
291
-
292
-
293
-
294
-
295
-
296
-
297
-
298
-
299
-
300
-
301
-
302
-
303
-
304
-
305
-
306
-
307
-
308
-
309
-
310
-
311
-
312
-
313
-
314
-
315
-
316
-
317
-
318
-
319
-
320
-
321
-
322
-
323
-
324
-
325
-
326
-
327
-
328
-
329
-
330
-
331
-
332
-
333
-
334
-
335
-
336
-
337
-
338
-
339
-
340
-
341
-
342
-
343
-
344
-
345
-
346
-
347
-
348
-
349
-
350
-
351
-
352
-
353
-
354
-
355
-
356
-
357
-
358
-
359
-
360
-
361
-
362
-
363
-
364
-
365
-
366
-
367
-
368
-
369
-
370
-
371
-
372
-
373
-
374
-
375
-
376
-
377
-
378
-
379
-
380
-
381
-
382
-
383
-
384
-
385
-
386
-
387
-
388
-
389
-
390
 |
 |

Business review
Risk, capital and liquidity management
201RBS Group Annual Report and Accounts 2009
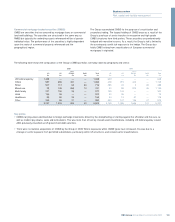
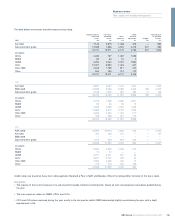
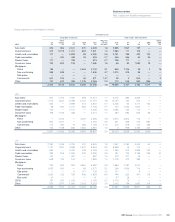
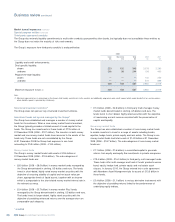
The table below analyses the movements in leveraged finance exposures for the year.
Drawn Undrawn Total
£m £m £m
Balance at 1 January 2009 12,619 3,150 15,769
Transfers in (from credit trading business) 563 41 604
Sales (247) (144) (391)
Repayments and facility reductions (934) (392) (1,326)
Funded deals 166 (166) —
Lapsed/collapsed deals — (19) (19)
Changes in fair value (31) — (31)
Accretion of interest 100 — 100
Impairment provisions (1,041) — (1,041)
Exchange and other movements (655) (190) (845)
Balance at 31 December 2009 10,540 2,280 12,820
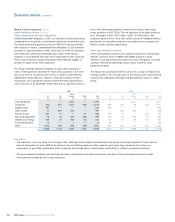
Key points
•Since the beginning of the credit market dislocation in the second half of 2007, investor appetite for leveraged loans and similar risky assets has
fallen dramatically, with higher perceived risk of default due to the leverage involved. Furthermore, secondary prices of leveraged loans traded fell
due to selling pressure and margins increasing, as well as reduced activity in the primary market.
•During 2009 the Group’s sterling exposure has declined, largely as a result of the weakening of the US dollar and euro against sterling during the
period.
•There have also been a number of credit impairments and write-offs during 2009, including some names which the Group previously held as part
of its syndicate portfolio.
•Early repayments as a result of re-financings have further reduced the exposure.
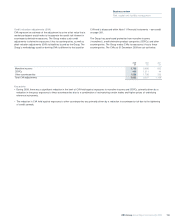
Not included in the table above are:
•UK Corporate leveraged finance net exposures of £7.1 billion at 31 December 2009 (2008 – £6.9 billion) related to debt and banking facilities
provided to UK mid-corporates. Of this, £1.4 billion related to facilities provided to client in the retail sector and £2.1 billion to the industrial sector
(2008 – £1.4 billion and £2.5 billion respectively).
•Ulster Bank leveraged finance net exposures of £0.6 billion at 31 December 2009 (2008 – £0.7 billion).
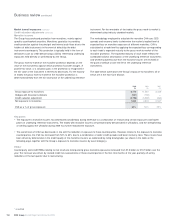
Special purpose entities (SPEs)
The Group arranges securitisations to facilitate client transactions and
undertakes securitisations to sell financial assets or to fund specific
portfolios of assets. The Group also acts as an underwriter and depositor
in securitisation transactions involving both client and proprietary
transactions. In a securitisation, assets, or interests in a pool of assets,
are transferred generally to a special purpose entity (SPE) which then
issues liabilities to third party investors. SPEs are vehicles established for
a specific, limited purpose, usually do not carry out a business or trade
and typically have no employees. They take a variety of legal forms –
trusts, partnerships and companies – and fulfil many different functions.
As well as being a key element of securitisations, SPEs are also used in
fund management activities to segregate custodial duties from the fund
management advice provided by the Group.
It is primarily the extent of risks and rewards assumed that determines
whether these entities are consolidated in the Group’s financial
statements. The following section aims to address the significant
exposures which arise from the Group’s activities through specific types
of SPEs.
The Group sponsors and arranges own-asset securitisations, whereby
the sale of assets or interests in a pool of assets into an SPE is financed
by the issuance of securities to investors. The pool of assets held by the
SPE may be originated by the Group, or (in the case of whole loan
programmes) purchased from third parties, and may be of varying
credit quality. Investors in the debt securities issued by the SPE are
rewarded through credit-linked returns, according to the credit rating of
their securities. The majority of securitisations are supported through
liquidity facilities, other credit enhancements and derivative hedges
extended by financial institutions, some of which offer protection against
initial defaults in the pool of assets. Thereafter, losses are absorbed by
investors in the lowest ranking notes in the priority of payments.
Investors in the most senior ranking debt securities are typically
shielded from loss, since any subsequent losses may trigger repayment
of their initial principal.