RBS 2009 Annual Report Download - page 165
Download and view the complete annual report
Please find page 165 of the 2009 RBS annual report below. You can navigate through the pages in the report by either clicking on the pages listed below, or by using the keyword search tool below to find specific information within the annual report.-
 1
1 -
2
-
3
-
4
-
5
-
6
-
7
-
8
-
9
-
10
-
11
-
12
-
13
-
14
-
15
-
16
-
17
-
18
-
19
-
20
-
21
-
22
-
23
-
24
-
25
-
26
-
27
-
28
-
29
-
30
-
31
-
32
-
33
-
34
-
35
-
36
-
37
-
38
-
39
-
40
-
41
-
42
-
43
-
44
-
45
-
46
-
47
-
48
-
49
-
50
-
51
-
52
-
53
-
54
-
55
-
56
-
57
-
58
-
59
-
60
-
61
-
62
-
63
-
64
-
65
-
66
-
67
-
68
-
69
-
70
-
71
-
72
-
73
-
74
-
75
-
76
-
77
-
78
-
79
-
80
-
81
-
82
-
83
-
84
-
85
-
86
-
87
-
88
-
89
-
90
-
91
-
92
-
93
-
94
-
95
-
96
-
97
-
98
-
99
-
100
-
101
-
102
-
103
-
104
-
105
-
106
-
107
-
108
-
109
-
110
-
111
-
112
-
113
-
114
-
115
-
116
-
117
-
118
-
119
-
120
-
121
-
122
-
123
-
124
-
125
-
126
-
127
-
128
-
129
-
130
-
131
-
132
-
133
-
134
-
135
-
136
-
137
-
138
-
139
-
140
-
141
-
142
-
143
-
144
-
145
-
146
-
147
-
148
-
149
-
150
-
151
-
152
-
153
-
154
-
 155
155 -
 156
156 -
 157
157 -
 158
158 -
 159
159 -
 160
160 -
 161
161 -
 162
162 -
 163
163 -
 164
164 -
 165
165 -
 166
166 -
 167
167 -
 168
168 -
 169
169 -
 170
170 -
 171
171 -
 172
172 -
 173
173 -
 174
174 -
 175
175 -
176
-
177
-
178
-
179
-
180
-
181
-
182
-
183
-
184
-
185
-
186
-
187
-
188
-
189
-
190
-
191
-
192
-
193
-
194
-
195
-
196
-
197
-
198
-
199
-
200
-
201
-
202
-
203
-
204
-
205
-
206
-
207
-
208
-
209
-
210
-
211
-
212
-
213
-
214
-
215
-
216
-
217
-
218
-
219
-
220
-
221
-
222
-
223
-
224
-
225
-
226
-
227
-
228
-
229
-
230
-
231
-
232
-
233
-
234
-
235
-
236
-
237
-
238
-
239
-
240
-
241
-
242
-
243
-
244
-
245
-
246
-
247
-
248
-
249
-
250
-
251
-
252
-
253
-
254
-
255
-
256
-
257
-
258
-
259
-
260
-
261
-
262
-
263
-
264
-
265
-
266
-
267
-
268
-
269
-
270
-
271
-
272
-
273
-
274
-
275
-
276
-
277
-
278
-
279
-
280
-
281
-
282
-
283
-
284
-
285
-
286
-
287
-
288
-
289
-
290
-
291
-
292
-
293
-
294
-
295
-
296
-
297
-
298
-
299
-
300
-
301
-
302
-
303
-
304
-
305
-
306
-
307
-
308
-
309
-
310
-
311
-
312
-
313
-
314
-
315
-
316
-
317
-
318
-
319
-
320
-
321
-
322
-
323
-
324
-
325
-
326
-
327
-
328
-
329
-
330
-
331
-
332
-
333
-
334
-
335
-
336
-
337
-
338
-
339
-
340
-
341
-
342
-
343
-
344
-
345
-
346
-
347
-
348
-
349
-
350
-
351
-
352
-
353
-
354
-
355
-
356
-
357
-
358
-
359
-
360
-
361
-
362
-
363
-
364
-
365
-
366
-
367
-
368
-
369
-
370
-
371
-
372
-
373
-
374
-
375
-
376
-
377
-
378
-
379
-
380
-
381
-
382
-
383
-
384
-
385
-
386
-
387
-
388
-
389
-
390
 |
 |

Business review
Risk, capital and liquidity management
163RBS Group Annual Report and Accounts 2009
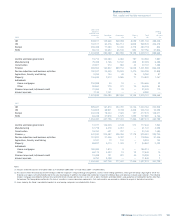
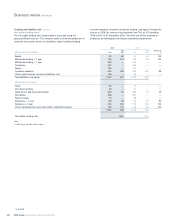
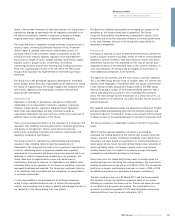
2009 (99%ile) 2008 (99%ile)
Average Period end Maximum Minimum Average Period end Maximum Minimum
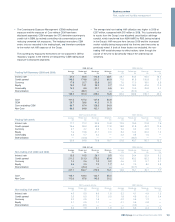
Trading VaR Summary (2008 and 2009) £m £m £m £m £m £m £m £m
Interest rate 57.0 50.5 112.8 28.1 38.7 54.4 94.0 18.2
Credit spread 148.3 174.8 231.2 66.9 71.5 61.5 130.8 51.7
Currency 17.9 20.7 35.8 9.2 7.6 17.0 18.0 3.5
Equity 13.0 13.1 23.2 2.7 22.4 18.3 42.6 11.0
Commodity 14.3 8.9 32.1 6.5 9.9 10.0 25.8 0.2
Diversification — (86.1) — — — (52.4) — —
155.2 181.9 229.0 76.8 82.3 108.8 155.7 49.3
Core 101.5 127.3 137.8 54.8
CEM 29.7 38.6 41.3 11.5
Core excluding CEM 86.7 97.4 128.5 54.9
Non-Core 86.3 84.8 162.1 29.3
2007 (scaled to 99%ile) 2007 (95%ile)
Average Period end Maximum Minimum Average Period end Maximum Minimum
Trading VaR (2007) £m £m £m £m £m £m £m £m
Interest rate 17.7 21.2 30.9 10.8 12.5 15.0 21.8 7.6
Credit spread 26.6 59.3 63.9 17.8 18.8 41.9 45.2 12.6
Currency 3.7 4.2 9.8 1.6 2.6 3.0 6.9 1.1
Equity 7.6 19.8 31.1 2.0 5.4 14.0 22.0 1.4
Commodity 0.3 0.7 2.2 — 0.2 0.5 1.6 —
Diversification — (40.6) — — — (28.7) — —
30.6 64.6 70.8 18.7 21.6 45.7 50.1 13.2
2009 (99%ile) 2008 (99%ile)
Average Period end Maximum Minimum Average Period end Maximum Minimum
Non-trading VaR (2008 and 2009) £m £m £m £m £m £m £m £m
Interest rate 15.5 16.5 26.1 9.5 10.6 24.4 32.9 5.2
Credit spread 211.2 213.3 270.3 65.4 10.5 65.2 65.2 5.5
Currency 1.4 0.6 7.0 0.2 0.6 2.2 5.7 0.1
Equity 3.6 2.3 7.2 1.7 3.4 7.0 8.0 0.8
Diversification — (26.0) — — — (22.7) — —
207.1 206.7 274.9 76.1 14.8 76.1 76.1 7.7
Core 105.1 129.4 142.7 55.0
Non-Core 112.6 87.6 145.3 20.2
2007 (scaled to 99%ile) 2007 (95%ile)
Average Period end Maximum Minimum Average Period end Maximum Minimum
Non-trading VaR (2007) £m £m £m £m £m £m £m £m
Interest rate 4.5 5.9 6.9 1.8 3.2 4.1 4.9 1.3
Credit spread 2.5 6.3 7.3 0.5 1.8 4.5 5.1 0.4
Currency 0.2 0.9 1.8 — 0.2 0.6 1.2 —
Equity 0.1 0.9 1.1 — 0.1 0.6 0.8 —
Diversification — (6.1) — — — (4.3) — —
5.2 7.9 9.1 1.9 3.7 5.5 6.4 1.3
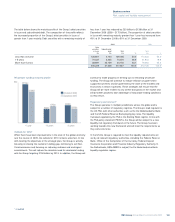
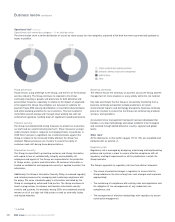
•The Counterparty Exposure Management (CEM) trading book
exposure and the exposure of Core without CEM have been
disclosed separately. CEM manages the OTC derivative counterparty
credit risk in GBM, by actively controlling risk concentrations and
reducing unwanted risk exposures. The hedging transactions CEM
enters into are recorded in the trading book, and therefore contribute
to the market risk VaR exposure of the Group.
The counterparty exposures themselves are not captured in VaR for
regulatory capital. In the interest of transparency CEM trading book
exposure is disclosed separately.
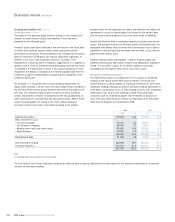
•The average total non-trading VaR utilisation was higher in 2009 at
£207 million, compared with £15 million in 2008. This is primarily due
to assets from the Group's now dissolved securitisation arbitrage
conduit, which transferred from ABN AMRO to RBS, being included
in the Group’s VaR measure from January 2009 and the increased
market volatility being incorporated into the two year time series as
previously noted. If both of these factors are excluded, the non-
trading VaR would decrease to reflect actions taken through the
course of the year to dynamically reduce the underlying risk
sensitivity.