RBS 2009 Annual Report Download - page 361
Download and view the complete annual report
Please find page 361 of the 2009 RBS annual report below. You can navigate through the pages in the report by either clicking on the pages listed below, or by using the keyword search tool below to find specific information within the annual report.-
 1
1 -
2
-
3
-
4
-
5
-
6
-
7
-
8
-
9
-
10
-
11
-
12
-
13
-
14
-
15
-
16
-
17
-
18
-
19
-
20
-
21
-
22
-
23
-
24
-
25
-
26
-
27
-
28
-
29
-
30
-
31
-
32
-
33
-
34
-
35
-
36
-
37
-
38
-
39
-
40
-
41
-
42
-
43
-
44
-
45
-
46
-
47
-
48
-
49
-
50
-
51
-
52
-
53
-
54
-
55
-
56
-
57
-
58
-
59
-
60
-
61
-
62
-
63
-
64
-
65
-
66
-
67
-
68
-
69
-
70
-
71
-
72
-
73
-
74
-
75
-
76
-
77
-
78
-
79
-
80
-
81
-
82
-
83
-
84
-
85
-
86
-
87
-
88
-
89
-
90
-
91
-
92
-
93
-
94
-
95
-
96
-
97
-
98
-
99
-
100
-
101
-
102
-
103
-
104
-
105
-
106
-
107
-
108
-
109
-
110
-
111
-
112
-
113
-
114
-
115
-
116
-
117
-
118
-
119
-
120
-
121
-
122
-
123
-
124
-
125
-
126
-
127
-
128
-
129
-
130
-
131
-
132
-
133
-
134
-
135
-
136
-
137
-
138
-
139
-
140
-
141
-
142
-
143
-
144
-
145
-
146
-
147
-
148
-
149
-
150
-
151
-
152
-
153
-
154
-
155
-
156
-
157
-
158
-
159
-
160
-
161
-
162
-
163
-
164
-
165
-
166
-
167
-
168
-
169
-
170
-
171
-
172
-
173
-
174
-
175
-
176
-
177
-
178
-
179
-
180
-
181
-
182
-
183
-
184
-
185
-
186
-
187
-
188
-
189
-
190
-
191
-
192
-
193
-
194
-
195
-
196
-
197
-
198
-
199
-
200
-
201
-
202
-
203
-
204
-
205
-
206
-
207
-
208
-
209
-
210
-
211
-
212
-
213
-
214
-
215
-
216
-
217
-
218
-
219
-
220
-
221
-
222
-
223
-
224
-
225
-
226
-
227
-
228
-
229
-
230
-
231
-
232
-
233
-
234
-
235
-
236
-
237
-
238
-
239
-
240
-
241
-
242
-
243
-
244
-
245
-
246
-
247
-
248
-
249
-
250
-
251
-
252
-
253
-
254
-
255
-
256
-
257
-
258
-
259
-
260
-
261
-
262
-
263
-
264
-
265
-
266
-
267
-
268
-
269
-
270
-
271
-
272
-
273
-
274
-
275
-
276
-
277
-
278
-
279
-
280
-
281
-
282
-
283
-
284
-
285
-
286
-
287
-
288
-
289
-
290
-
291
-
292
-
293
-
294
-
295
-
296
-
297
-
298
-
299
-
300
-
301
-
302
-
303
-
304
-
305
-
306
-
307
-
308
-
309
-
310
-
311
-
312
-
313
-
314
-
315
-
316
-
317
-
318
-
319
-
320
-
321
-
322
-
323
-
324
-
325
-
326
-
327
-
328
-
329
-
330
-
331
-
332
-
333
-
334
-
335
-
336
-
337
-
338
-
339
-
340
-
341
-
342
-
343
-
344
-
345
-
346
-
347
-
348
-
349
-
350
-
 351
351 -
 352
352 -
 353
353 -
 354
354 -
 355
355 -
 356
356 -
 357
357 -
 358
358 -
 359
359 -
 360
360 -
 361
361 -
 362
362 -
 363
363 -
 364
364 -
 365
365 -
 366
366 -
 367
367 -
 368
368 -
 369
369 -
 370
370 -
 371
371 -
372
-
373
-
374
-
375
-
376
-
377
-
378
-
379
-
380
-
381
-
382
-
383
-
384
-
385
-
386
-
387
-
388
-
389
-
390
 |
 |

Additional information
359RBS Group Annual Report and Accounts 2009
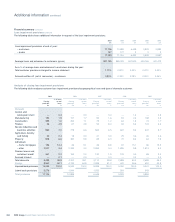
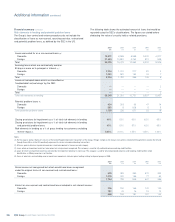
Other contractual cash obligations
The table below summarises the Group’s other contractual cash obligations by payment date.
Group
0-3 months 3-12 months 1-3 years 3-5 years 5-10 years 10-20 years
2009 £m £m £m £m £m £m
Operating leases 140 339 965 726 1,219 1,836
Contractual obligations to purchase goods or services 180 300 168 16 — 1
320 639 1,133 742 1,219 1,837
2008
Operating leases 146 433 976 751 1,448 1,851
Contractual obligations to purchase goods or services 237 892 486 208 303 1
383 1,325 1,462 959 1,751 1,852
The Group’s undrawn formal facilities, credit lines and other commitments to lend were £291,634 million (2008 – £352,398 million). While the Group
has given commitments to provide these funds, some facilities may be subject to certain conditions being met by the counterparty. The Group does
not expect all facilities to be drawn, and some may lapse before drawdown.
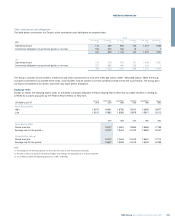
Exchange rates
Except as stated, the following tables show , for the dates or periods indicated, the Noon Buying Rate in New York for cable transfers in sterling as
certified for customs purposes by the Federal Reserve Bank of New York.
January December November October September August
US dollars per £1 2010 2009 2009 2009 2009 2009
Noon Buying Rate
High 1.6370 1.6641 1.6795 1.6610 1.6695 1.6977
Low 1.5912 1.5892 1.6383 1.5878 1.5910 1.6212
2009 2008 2007 2006 2005
Noon Buying Rate
Period end rate 1.6167 1.4619 1.9843 1.9586 1.7188
Average rate for the period (1) 1.5707 1.8424 2.0073 1.8582 1.8147
Consolidation rate (2)
Period end rate 1.6222 1.4604 2.0043 1.9651 1.7214
Average rate for the period 1.5657 1.8528 2.0015 1.8436 1.8198
Notes:
(1) The average of the Noon Buying Rates on the last business day of each month during the period.
(2) The rates used by the Group for translating US dollars into sterling in the preparation of its financial statements.
(3) On 23 February 2010, the Noon Buying Rate was £1.00 = US$1.5432.