RBS 2009 Annual Report Download - page 316
Download and view the complete annual report
Please find page 316 of the 2009 RBS annual report below. You can navigate through the pages in the report by either clicking on the pages listed below, or by using the keyword search tool below to find specific information within the annual report.-
 1
1 -
2
-
3
-
4
-
5
-
6
-
7
-
8
-
9
-
10
-
11
-
12
-
13
-
14
-
15
-
16
-
17
-
18
-
19
-
20
-
21
-
22
-
23
-
24
-
25
-
26
-
27
-
28
-
29
-
30
-
31
-
32
-
33
-
34
-
35
-
36
-
37
-
38
-
39
-
40
-
41
-
42
-
43
-
44
-
45
-
46
-
47
-
48
-
49
-
50
-
51
-
52
-
53
-
54
-
55
-
56
-
57
-
58
-
59
-
60
-
61
-
62
-
63
-
64
-
65
-
66
-
67
-
68
-
69
-
70
-
71
-
72
-
73
-
74
-
75
-
76
-
77
-
78
-
79
-
80
-
81
-
82
-
83
-
84
-
85
-
86
-
87
-
88
-
89
-
90
-
91
-
92
-
93
-
94
-
95
-
96
-
97
-
98
-
99
-
100
-
101
-
102
-
103
-
104
-
105
-
106
-
107
-
108
-
109
-
110
-
111
-
112
-
113
-
114
-
115
-
116
-
117
-
118
-
119
-
120
-
121
-
122
-
123
-
124
-
125
-
126
-
127
-
128
-
129
-
130
-
131
-
132
-
133
-
134
-
135
-
136
-
137
-
138
-
139
-
140
-
141
-
142
-
143
-
144
-
145
-
146
-
147
-
148
-
149
-
150
-
151
-
152
-
153
-
154
-
155
-
156
-
157
-
158
-
159
-
160
-
161
-
162
-
163
-
164
-
165
-
166
-
167
-
168
-
169
-
170
-
171
-
172
-
173
-
174
-
175
-
176
-
177
-
178
-
179
-
180
-
181
-
182
-
183
-
184
-
185
-
186
-
187
-
188
-
189
-
190
-
191
-
192
-
193
-
194
-
195
-
196
-
197
-
198
-
199
-
200
-
201
-
202
-
203
-
204
-
205
-
206
-
207
-
208
-
209
-
210
-
211
-
212
-
213
-
214
-
215
-
216
-
217
-
218
-
219
-
220
-
221
-
222
-
223
-
224
-
225
-
226
-
227
-
228
-
229
-
230
-
231
-
232
-
233
-
234
-
235
-
236
-
237
-
238
-
239
-
240
-
241
-
242
-
243
-
244
-
245
-
246
-
247
-
248
-
249
-
250
-
251
-
252
-
253
-
254
-
255
-
256
-
257
-
258
-
259
-
260
-
261
-
262
-
263
-
264
-
265
-
266
-
267
-
268
-
269
-
270
-
271
-
272
-
273
-
274
-
275
-
276
-
277
-
278
-
279
-
280
-
281
-
282
-
283
-
284
-
285
-
286
-
287
-
288
-
289
-
290
-
291
-
292
-
293
-
294
-
295
-
296
-
297
-
298
-
299
-
300
-
301
-
302
-
303
-
304
-
305
-
 306
306 -
 307
307 -
 308
308 -
 309
309 -
 310
310 -
 311
311 -
 312
312 -
 313
313 -
 314
314 -
 315
315 -
 316
316 -
 317
317 -
 318
318 -
 319
319 -
 320
320 -
 321
321 -
 322
322 -
 323
323 -
 324
324 -
 325
325 -
 326
326 -
327
-
328
-
329
-
330
-
331
-
332
-
333
-
334
-
335
-
336
-
337
-
338
-
339
-
340
-
341
-
342
-
343
-
344
-
345
-
346
-
347
-
348
-
349
-
350
-
351
-
352
-
353
-
354
-
355
-
356
-
357
-
358
-
359
-
360
-
361
-
362
-
363
-
364
-
365
-
366
-
367
-
368
-
369
-
370
-
371
-
372
-
373
-
374
-
375
-
376
-
377
-
378
-
379
-
380
-
381
-
382
-
383
-
384
-
385
-
386
-
387
-
388
-
389
-
390
 |
 |

RBS Group Annual Report and Accounts 2009314
Notes on the accounts continued
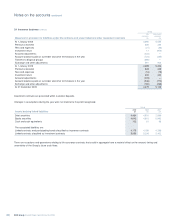
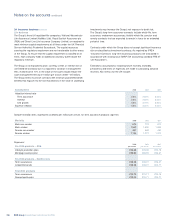
Claims reserves
It is the Group’s policy to hold undiscounted claims reserves (including
reserves to cover claims which have been incurred but not reported
(IBNR reserves)) for all classes at a sufficient level to meet all liabilities
as they fall due.
The Group’s focus is on high volume and relatively straightforward
products, for example home and motor. This facilitates the generation of
comprehensive underwriting and claims data, which are used to
accurately price and monitor the risks accepted.
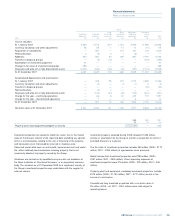
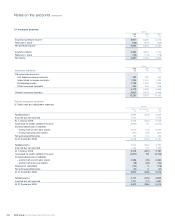
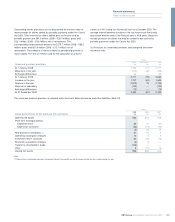
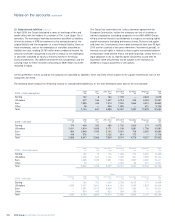
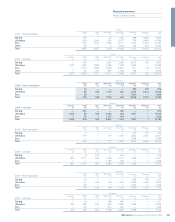
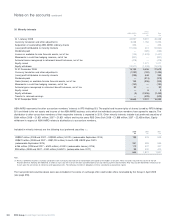
24 Insurance business continued
Accident year
Insurance claims – 2001 2002 2003 2004 2005 2006 2007 2008 2009 Total
net of reinsurance £m £m £m £m £m £m £m £m £m £m
Estimate of ultimate
claims costs:
At end of accident year 2,011 2,584 3,215 3,514 4,168 4,215 4,572 4,034 4,360 32,673
One year later (61) 59 (106) (168) (67) (261) (90) 24 (670)
Two years later 22 (12) (103) (90) (161) (87) (17) (448)
Three years later 13 (3) (53) (81) (64) (23) (211)
Four years later (41) (21) (44) (46) (60) (212)
Five years later 1 (24) (23) (19) (65)
Six years later (19) (5) (34) (58)
Seven years later — (11) (11)
Eight years later 1 1
Current estimate of
cumulative claims 1,927 2,567 2,852 3,110 3,816 3,844 4,465 4,058 4,360 30,999
Cumulative payments
to date (1,881) (2,513) (2,759) (2,923) (3,503) (3,278) (3,665) (2,970) (2,157) (25,649)
46 54 93 187 313 566 800 1,088 2,203 5,350
Liability in respect of earlier years 62
Claims handling costs 104
Net general insurance claims liability 5,516
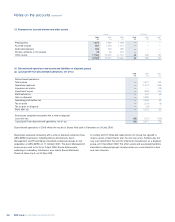
The following table shows loss ratios for each major class of business, gross and net of reinsurance.
2009 2008 2007
Earned Claims Loss Earned Loss Earned Loss
premiums incurred ratio premiums ratio premiums ratio
£m £m % £m % £m %
Residential property Gross 1,129 597 53 1,103 48 1,087 82
Net 1,065 596 56 1,034 51 1,020 86
Personal motor Gross 2,984 3,062 103 3,173 84 3,254 80
Net 2,901 2,997 103 3,075 83 3,161 81
Commercial property Gross 182 74 41 194 41 211 55
Net 166 74 45 174 46 191 60
Commercial motor Gross 136 136 100 143 91 142 75
Net 135 132 98 141 91 133 80
Other Gross 848 435 51 994 42 851 40
Net 845 429 51 828 51 839 41
Total Gross 5,279 4,304 82 5,607 68 5,545 73
Net 5,112 4,228 83 5,252 71 5,344 75
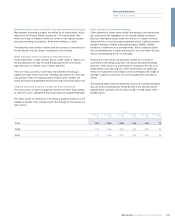
The Group has no interest rate exposure from general insurance liabilities because provisions for claims under short-term insurance contracts are
not discounted.