RBS 2009 Annual Report Download - page 342
Download and view the complete annual report
Please find page 342 of the 2009 RBS annual report below. You can navigate through the pages in the report by either clicking on the pages listed below, or by using the keyword search tool below to find specific information within the annual report.-
 1
1 -
2
-
3
-
4
-
5
-
6
-
7
-
8
-
9
-
10
-
11
-
12
-
13
-
14
-
15
-
16
-
17
-
18
-
19
-
20
-
21
-
22
-
23
-
24
-
25
-
26
-
27
-
28
-
29
-
30
-
31
-
32
-
33
-
34
-
35
-
36
-
37
-
38
-
39
-
40
-
41
-
42
-
43
-
44
-
45
-
46
-
47
-
48
-
49
-
50
-
51
-
52
-
53
-
54
-
55
-
56
-
57
-
58
-
59
-
60
-
61
-
62
-
63
-
64
-
65
-
66
-
67
-
68
-
69
-
70
-
71
-
72
-
73
-
74
-
75
-
76
-
77
-
78
-
79
-
80
-
81
-
82
-
83
-
84
-
85
-
86
-
87
-
88
-
89
-
90
-
91
-
92
-
93
-
94
-
95
-
96
-
97
-
98
-
99
-
100
-
101
-
102
-
103
-
104
-
105
-
106
-
107
-
108
-
109
-
110
-
111
-
112
-
113
-
114
-
115
-
116
-
117
-
118
-
119
-
120
-
121
-
122
-
123
-
124
-
125
-
126
-
127
-
128
-
129
-
130
-
131
-
132
-
133
-
134
-
135
-
136
-
137
-
138
-
139
-
140
-
141
-
142
-
143
-
144
-
145
-
146
-
147
-
148
-
149
-
150
-
151
-
152
-
153
-
154
-
155
-
156
-
157
-
158
-
159
-
160
-
161
-
162
-
163
-
164
-
165
-
166
-
167
-
168
-
169
-
170
-
171
-
172
-
173
-
174
-
175
-
176
-
177
-
178
-
179
-
180
-
181
-
182
-
183
-
184
-
185
-
186
-
187
-
188
-
189
-
190
-
191
-
192
-
193
-
194
-
195
-
196
-
197
-
198
-
199
-
200
-
201
-
202
-
203
-
204
-
205
-
206
-
207
-
208
-
209
-
210
-
211
-
212
-
213
-
214
-
215
-
216
-
217
-
218
-
219
-
220
-
221
-
222
-
223
-
224
-
225
-
226
-
227
-
228
-
229
-
230
-
231
-
232
-
233
-
234
-
235
-
236
-
237
-
238
-
239
-
240
-
241
-
242
-
243
-
244
-
245
-
246
-
247
-
248
-
249
-
250
-
251
-
252
-
253
-
254
-
255
-
256
-
257
-
258
-
259
-
260
-
261
-
262
-
263
-
264
-
265
-
266
-
267
-
268
-
269
-
270
-
271
-
272
-
273
-
274
-
275
-
276
-
277
-
278
-
279
-
280
-
281
-
282
-
283
-
284
-
285
-
286
-
287
-
288
-
289
-
290
-
291
-
292
-
293
-
294
-
295
-
296
-
297
-
298
-
299
-
300
-
301
-
302
-
303
-
304
-
305
-
306
-
307
-
308
-
309
-
310
-
311
-
312
-
313
-
314
-
315
-
316
-
317
-
318
-
319
-
320
-
321
-
322
-
323
-
324
-
325
-
326
-
327
-
328
-
329
-
330
-
331
-
 332
332 -
 333
333 -
 334
334 -
 335
335 -
 336
336 -
 337
337 -
 338
338 -
 339
339 -
 340
340 -
 341
341 -
 342
342 -
 343
343 -
 344
344 -
 345
345 -
 346
346 -
 347
347 -
 348
348 -
 349
349 -
 350
350 -
 351
351 -
 352
352 -
353
-
354
-
355
-
356
-
357
-
358
-
359
-
360
-
361
-
362
-
363
-
364
-
365
-
366
-
367
-
368
-
369
-
370
-
371
-
372
-
373
-
374
-
375
-
376
-
377
-
378
-
379
-
380
-
381
-
382
-
383
-
384
-
385
-
386
-
387
-
388
-
389
-
390
 |
 |
RBS Group Annual Report and Accounts 2009340
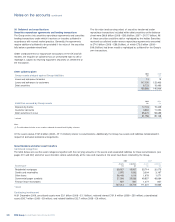
Notes on the accounts continued
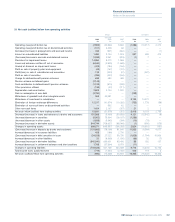
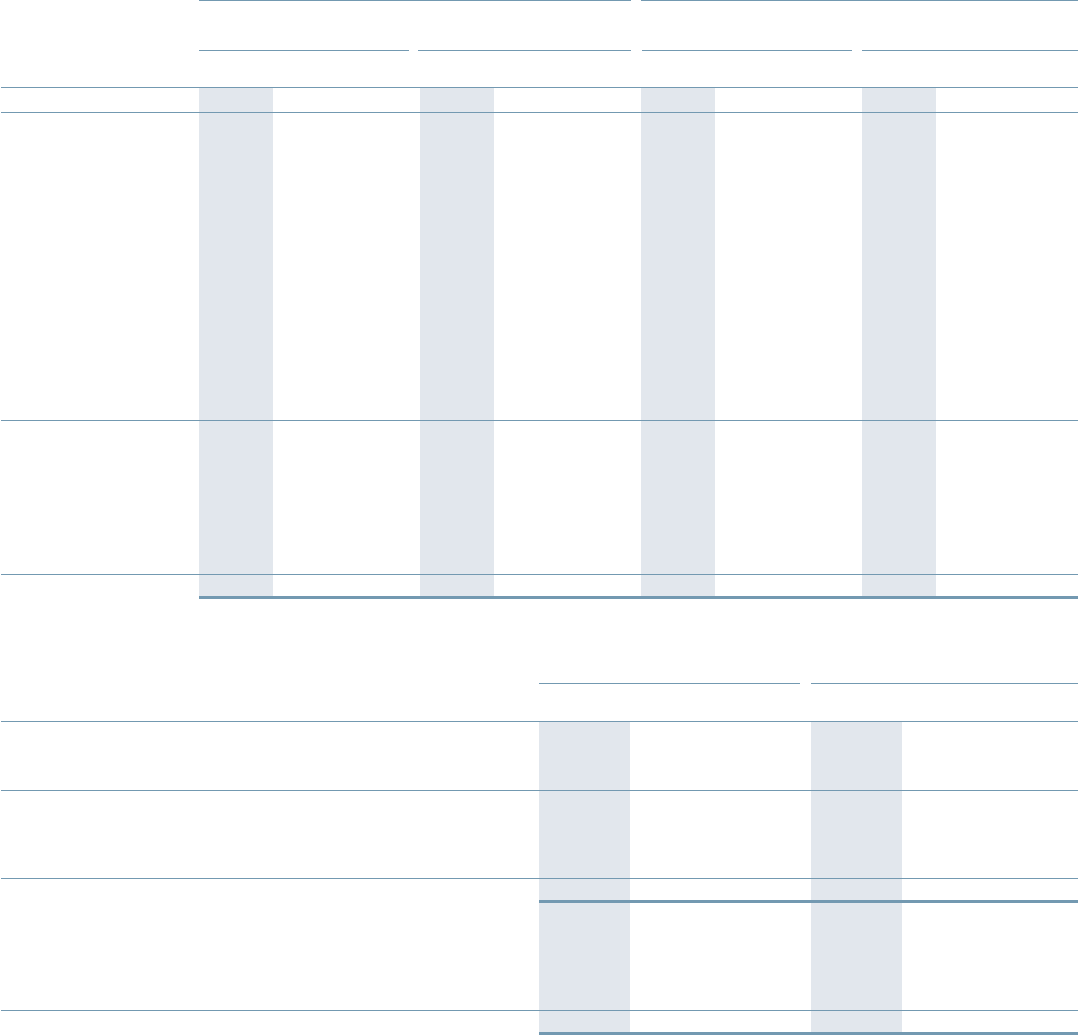
36 Analysis of changes in financing during the year
Group Company
Share capital, Share capital,
share premium, paid-in share premium, paid-in
equity and merger reserve Subordinated liabilities equity and merger reserve Subordinated liabilities
2009 2008 2007 2009 2008 2007 2009 2008 2007 2009 2008 2007
£m £m £m £m £m £m £m £m £m £m £m £m
At 1 January 49,323 31,806 24,178 49,154 38,043 27,654 38,442 20,925 13,297 10,314 7,743 8,194
Issue of ordinary shares — 49 77 — — — —49 77 ———
Issue of other
equity securities — — 4,673 — — — —— 4,673 ———
Redemption of
preference shares (5,000) —————(5,000) —————
Placing and open offer 5,274 19,741 ————5,274 19,741 — ———
Rights issue — 12,000 —————12,000 — ———
Issue of B shares 25,101 —————12,801 —————
Redemption of
paid in equity (308) —————(308) —————
Net proceeds from issue of
subordinated liabilities — ——2,309 2,413 1,018 ——————
Repayment of
subordinated liabilities — ——(5,145) (1,727) (1,708) ———(458) — (469)
Net cash inflow/(outflow)
from financing 25,067 31,790 4,750 (2,836) 686 (690) 12,767 31,790 4,750 (458) — (469)
Investment in subsidiaries — — 2,719 —— 10,256 12,300 — 2,719 ———
Transfer to
retained earnings (10,150) (14,273) — ———(10,150) (14,273) — ———
Currency translation and
other adjustments — — 159 (8,666) 10,425 823 —— 159 (1,094) 2,571 18
At 31 December 64,240 49,323 31,806 37,652 49,154 38,043 53,359 38,442 20,925 8,762 10,314 7,743
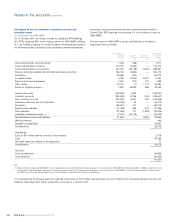
37 Analysis of cash and cash equivalents Group Company
2009 2008 2007 2009 2008 2007
£m £m £m £m £m £m
At 1 January
– cash 72,425 52,796 28,378 —511
– cash equivalents 62,500 96,159 43,273 5,069 1,568 646
134,925 148,955 71,651 5,069 1,573 657
Acquisition of subsidiaries — — 60,098 ———
Disposal of subsidiaries — (3,171) — ———
Net cash inflow/(outflow) 9,261 (10,859) 17,206 11,379 3,496 916
At 31 December 144,186 134,925 148,955 16,448 5,069 1,573
Comprising:
Cash and balances at central banks 51,811 12,007 17,428 ———
Treasury bills and debt securities 15,818 15,623 6,818 ———
Loans and advances to banks 76,557 107,295 124,709 16,448 5,069 1,573
Cash and cash equivalents 144,186 134,925 148,955 16,448 5,069 1,573
Certain subsidiary undertakings are required to maintain balances with the Bank of England which, at 31 December 2009, amounted to £450 million
(2008 – £393 million; 2007 – £439 million). Certain subsidiary undertakings are required by law to maintain reserve balances with the Federal Reserve
Bank in the US. Such reserve balances were nil at 31 December 2009 (2008 – nil; 2007 – US$1 million). ABN AMRO had mandatory reserve deposits
of 6 million at 31 December 2009 (2008 – 3 million; 2007 – 6 million).