RBS 2009 Annual Report Download - page 313
Download and view the complete annual report
Please find page 313 of the 2009 RBS annual report below. You can navigate through the pages in the report by either clicking on the pages listed below, or by using the keyword search tool below to find specific information within the annual report.-
 1
1 -
2
-
3
-
4
-
5
-
6
-
7
-
8
-
9
-
10
-
11
-
12
-
13
-
14
-
15
-
16
-
17
-
18
-
19
-
20
-
21
-
22
-
23
-
24
-
25
-
26
-
27
-
28
-
29
-
30
-
31
-
32
-
33
-
34
-
35
-
36
-
37
-
38
-
39
-
40
-
41
-
42
-
43
-
44
-
45
-
46
-
47
-
48
-
49
-
50
-
51
-
52
-
53
-
54
-
55
-
56
-
57
-
58
-
59
-
60
-
61
-
62
-
63
-
64
-
65
-
66
-
67
-
68
-
69
-
70
-
71
-
72
-
73
-
74
-
75
-
76
-
77
-
78
-
79
-
80
-
81
-
82
-
83
-
84
-
85
-
86
-
87
-
88
-
89
-
90
-
91
-
92
-
93
-
94
-
95
-
96
-
97
-
98
-
99
-
100
-
101
-
102
-
103
-
104
-
105
-
106
-
107
-
108
-
109
-
110
-
111
-
112
-
113
-
114
-
115
-
116
-
117
-
118
-
119
-
120
-
121
-
122
-
123
-
124
-
125
-
126
-
127
-
128
-
129
-
130
-
131
-
132
-
133
-
134
-
135
-
136
-
137
-
138
-
139
-
140
-
141
-
142
-
143
-
144
-
145
-
146
-
147
-
148
-
149
-
150
-
151
-
152
-
153
-
154
-
155
-
156
-
157
-
158
-
159
-
160
-
161
-
162
-
163
-
164
-
165
-
166
-
167
-
168
-
169
-
170
-
171
-
172
-
173
-
174
-
175
-
176
-
177
-
178
-
179
-
180
-
181
-
182
-
183
-
184
-
185
-
186
-
187
-
188
-
189
-
190
-
191
-
192
-
193
-
194
-
195
-
196
-
197
-
198
-
199
-
200
-
201
-
202
-
203
-
204
-
205
-
206
-
207
-
208
-
209
-
210
-
211
-
212
-
213
-
214
-
215
-
216
-
217
-
218
-
219
-
220
-
221
-
222
-
223
-
224
-
225
-
226
-
227
-
228
-
229
-
230
-
231
-
232
-
233
-
234
-
235
-
236
-
237
-
238
-
239
-
240
-
241
-
242
-
243
-
244
-
245
-
246
-
247
-
248
-
249
-
250
-
251
-
252
-
253
-
254
-
255
-
256
-
257
-
258
-
259
-
260
-
261
-
262
-
263
-
264
-
265
-
266
-
267
-
268
-
269
-
270
-
271
-
272
-
273
-
274
-
275
-
276
-
277
-
278
-
279
-
280
-
281
-
282
-
283
-
284
-
285
-
286
-
287
-
288
-
289
-
290
-
291
-
292
-
293
-
294
-
295
-
296
-
297
-
298
-
299
-
300
-
301
-
302
-
 303
303 -
 304
304 -
 305
305 -
 306
306 -
 307
307 -
 308
308 -
 309
309 -
 310
310 -
 311
311 -
 312
312 -
 313
313 -
 314
314 -
 315
315 -
 316
316 -
 317
317 -
 318
318 -
 319
319 -
 320
320 -
 321
321 -
 322
322 -
 323
323 -
324
-
325
-
326
-
327
-
328
-
329
-
330
-
331
-
332
-
333
-
334
-
335
-
336
-
337
-
338
-
339
-
340
-
341
-
342
-
343
-
344
-
345
-
346
-
347
-
348
-
349
-
350
-
351
-
352
-
353
-
354
-
355
-
356
-
357
-
358
-
359
-
360
-
361
-
362
-
363
-
364
-
365
-
366
-
367
-
368
-
369
-
370
-
371
-
372
-
373
-
374
-
375
-
376
-
377
-
378
-
379
-
380
-
381
-
382
-
383
-
384
-
385
-
386
-
387
-
388
-
389
-
390
 |
 |

311RBS Group Annual Report and Accounts 2009
Financial statements
Notes on the accounts
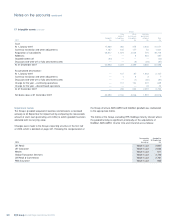
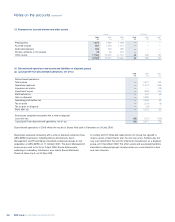
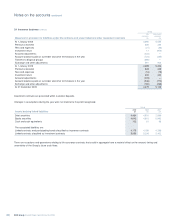
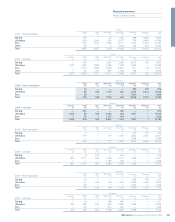
Group
Gross Reinsurance Net
Unearned premium provision £m £m £m
At 1 January 2008 2,752 (41) 2,711
Movement in the year (105) (38) (143)
Exchange differences 64 — 64
At 1 January 2009 2,711 (79) 2,632
Increase in the year 1,747 (63) 1,684
Release in the year (1,813) 75 (1,738)
Disposal of subsidiary (145) — (145)
Exchange differences (10) — (10)
At 31 December 2009 2,490 (67) 2,423
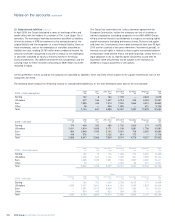
The unearned premium provision is included within Accruals, deferred income and other liabilities (Note 22).
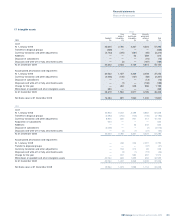
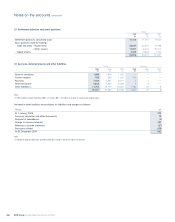
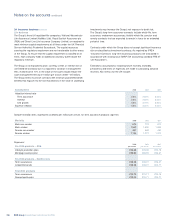
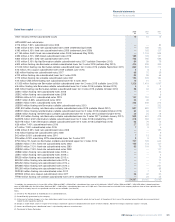
Group
2009 2008 2007
Gross performance of life business (life contracts) £m £m £m
Opening net assets 588 604 579
Profit from existing business:
Expected return 35 41 35
Experience variances (38) (15) (23)
(3) 26 12
New business contribution (1) 31 14 5
Operating assumption changes 10 26
Investment return variances 32 (46) (14)
Economic assumption changes (4) (2) —
Transfer to shareholders’ funds (106) ——
Other 6(10) 16
Closing net assets 554 588 604
Note:
(1) New business contribution represents the present value of future profits on new insurance contract business written during the year.
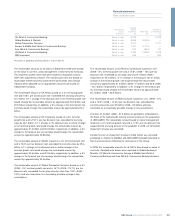
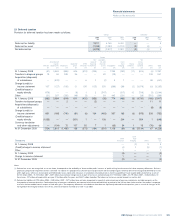
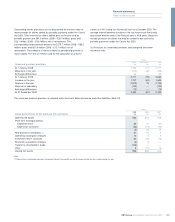
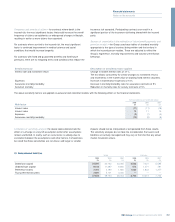
Outstanding claims provisions are not discounted for the time value of
money except for claims settled by periodic payments under the Courts
Act 2003. Total reserves for claims settled prior to the year end by
periodic payment are £91.6 million (2008 – £29.0 million) gross and
£26.1 million (2008 – £3.6 million) net of reinsurance. The
corresponding undiscounted amounts are £275.7 million (2008 – £85.0
million) gross and £61.8 million (2008 – £12.1 million) net of
reinsurance. The category of claims subject to periodical payments is
motor liability. The rate of interest used for the calculation of present
values is 4.14% being the 40-year gilt rate as at October 2009. The
average interval between the date of the last future cash flow being
discounted and the end of the financial year is 49.8 years. Reserves
include provision for claims that may be settled in due course by
periodic payments under the Courts Act 2003.
(ii) Provisions for unearned premiums and unexpired short-term
insurance risks