RBS 2009 Annual Report Download - page 306
Download and view the complete annual report
Please find page 306 of the 2009 RBS annual report below. You can navigate through the pages in the report by either clicking on the pages listed below, or by using the keyword search tool below to find specific information within the annual report.-
 1
1 -
2
-
3
-
4
-
5
-
6
-
7
-
8
-
9
-
10
-
11
-
12
-
13
-
14
-
15
-
16
-
17
-
18
-
19
-
20
-
21
-
22
-
23
-
24
-
25
-
26
-
27
-
28
-
29
-
30
-
31
-
32
-
33
-
34
-
35
-
36
-
37
-
38
-
39
-
40
-
41
-
42
-
43
-
44
-
45
-
46
-
47
-
48
-
49
-
50
-
51
-
52
-
53
-
54
-
55
-
56
-
57
-
58
-
59
-
60
-
61
-
62
-
63
-
64
-
65
-
66
-
67
-
68
-
69
-
70
-
71
-
72
-
73
-
74
-
75
-
76
-
77
-
78
-
79
-
80
-
81
-
82
-
83
-
84
-
85
-
86
-
87
-
88
-
89
-
90
-
91
-
92
-
93
-
94
-
95
-
96
-
97
-
98
-
99
-
100
-
101
-
102
-
103
-
104
-
105
-
106
-
107
-
108
-
109
-
110
-
111
-
112
-
113
-
114
-
115
-
116
-
117
-
118
-
119
-
120
-
121
-
122
-
123
-
124
-
125
-
126
-
127
-
128
-
129
-
130
-
131
-
132
-
133
-
134
-
135
-
136
-
137
-
138
-
139
-
140
-
141
-
142
-
143
-
144
-
145
-
146
-
147
-
148
-
149
-
150
-
151
-
152
-
153
-
154
-
155
-
156
-
157
-
158
-
159
-
160
-
161
-
162
-
163
-
164
-
165
-
166
-
167
-
168
-
169
-
170
-
171
-
172
-
173
-
174
-
175
-
176
-
177
-
178
-
179
-
180
-
181
-
182
-
183
-
184
-
185
-
186
-
187
-
188
-
189
-
190
-
191
-
192
-
193
-
194
-
195
-
196
-
197
-
198
-
199
-
200
-
201
-
202
-
203
-
204
-
205
-
206
-
207
-
208
-
209
-
210
-
211
-
212
-
213
-
214
-
215
-
216
-
217
-
218
-
219
-
220
-
221
-
222
-
223
-
224
-
225
-
226
-
227
-
228
-
229
-
230
-
231
-
232
-
233
-
234
-
235
-
236
-
237
-
238
-
239
-
240
-
241
-
242
-
243
-
244
-
245
-
246
-
247
-
248
-
249
-
250
-
251
-
252
-
253
-
254
-
255
-
256
-
257
-
258
-
259
-
260
-
261
-
262
-
263
-
264
-
265
-
266
-
267
-
268
-
269
-
270
-
271
-
272
-
273
-
274
-
275
-
276
-
277
-
278
-
279
-
280
-
281
-
282
-
283
-
284
-
285
-
286
-
287
-
288
-
289
-
290
-
291
-
292
-
293
-
294
-
295
-
 296
296 -
 297
297 -
 298
298 -
 299
299 -
 300
300 -
 301
301 -
 302
302 -
 303
303 -
 304
304 -
 305
305 -
 306
306 -
 307
307 -
 308
308 -
 309
309 -
 310
310 -
 311
311 -
 312
312 -
 313
313 -
 314
314 -
 315
315 -
 316
316 -
317
-
318
-
319
-
320
-
321
-
322
-
323
-
324
-
325
-
326
-
327
-
328
-
329
-
330
-
331
-
332
-
333
-
334
-
335
-
336
-
337
-
338
-
339
-
340
-
341
-
342
-
343
-
344
-
345
-
346
-
347
-
348
-
349
-
350
-
351
-
352
-
353
-
354
-
355
-
356
-
357
-
358
-
359
-
360
-
361
-
362
-
363
-
364
-
365
-
366
-
367
-
368
-
369
-
370
-
371
-
372
-
373
-
374
-
375
-
376
-
377
-
378
-
379
-
380
-
381
-
382
-
383
-
384
-
385
-
386
-
387
-
388
-
389
-
390
 |
 |

RBS Group Annual Report and Accounts 2009304
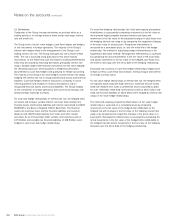
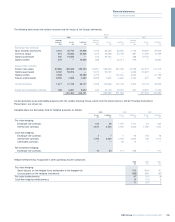
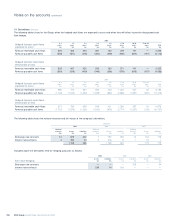
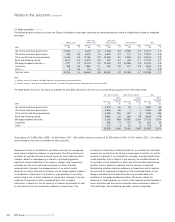
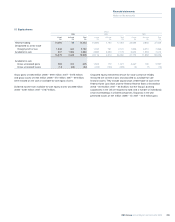
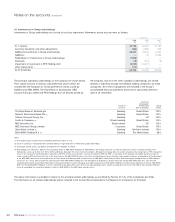
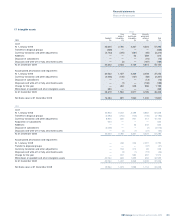
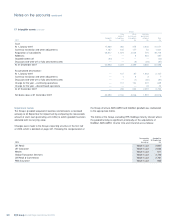
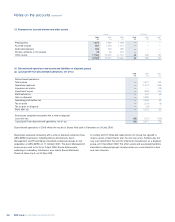
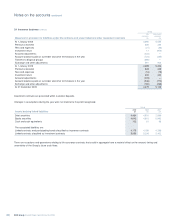
Notes on the accounts continued
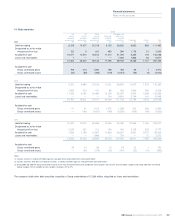
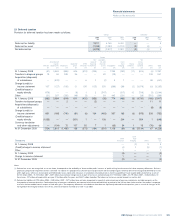
18 Property, plant and equipment Group
Long Short Computers Operating
Investment Freehold leasehold leasehold and other lease
properties premises premises premises equipment assets Total
2009 £m £m £m £m £m £m £m
Cost or valuation:
At 1 January 2009 3,868 4,032 224 1,867 4,168 9,334 23,493
Transfers to disposal groups — (32) — (62) (80) — (174)
Currency translation and other adjustments (85) (134) — (65) (131) (561) (976)
Disposal of subsidiaries — (15) — — (19) — (34)
Reclassifications 1 18 1 (34) 14 — —
Additions 1,634 304 8 153 750 2,241 5,090
Expenditure on investment properties 8 ————— 8
Change in fair value of investment properties (117) —————(117)
Disposals and write-off of fully depreciated assets (426) (75) (19) (56) (420) (1,456) (2,452)
At 31 December 2009 4,883 4,098 214 1,803 4,282 9,558 24,838
Accumulated impairment, depreciation and amortisation:
At 1 January 2009 — 422 79 492 1,916 1,635 4,544
Transfers to disposal groups — — — (7) (31) — (38)
Currency translation and other adjustments — (1) — (11) (48) (69) (129)
Disposal of subsidiaries — (1) — — (14) — (15)
Write-off of property, plant and equipment — 5 — 5 — — 10
Disposals and write-off of fully depreciated assets — — — (2) (126) (419) (547)
Charge for the year — 128 8 164 699 617 1,616
At 31 December 2009 — 553 87 641 2,396 1,764 5,441
Net book value at 31 December 2009 4,883 3,545 127 1,162 1,886 7,794 19,397
2008
Cost or valuation:
At 1 January 2008 3,431 3,645 215 1,688 3,929 11,437 24,345
Transfers to disposal groups — (262) — (188) (349) — (799)
Currency translation and other adjustments 320 452 5 149 436 1,313 2,675
Acquisition of subsidiaries — — — 30 31 — 61
Disposal of subsidiaries — — — (2) (57) (5,015) (5,074)
Reclassifications — (176) — 197 (14) (7) —
Additions 417 486 22 61 837 3,794 5,617
Expenditure on investment properties 8————— 8
Change in fair value of investment properties (86) —————(86)
Disposals and write-off of fully depreciated assets (222) (113) (18) (68) (645) (2,188) (3,254)
At 31 December 2008 3,868 4,032 224 1,867 4,168 9,334 23,493
Accumulated impairment, depreciation and amortisation:
At 1 January 2008 — 391 74 436 1,952 2,747 5,600
Transfers to disposal groups — (60) — (91) (243) — (394)
Currency translation and other adjustments — (9) 1 9 148 202 351
Disposal of subsidiaries — — — (1) (39) (1,447) (1,487)
Reclassifications — 17 (2) 1 (9) (7) —
Write-off of property, plant and equipment —19—— 7—26
Disposals and write-off of fully depreciated assets — (22) — (31) (539) (544) (1,136)
Charge for the year — 86 6 169 639 684 1,584
At 31 December 2008 — 422 79 492 1,916 1,635 4,544
Net book value at 31 December 2008 3,868 3,610 145 1,375 2,252 7,699 18,949