RBS 2009 Annual Report Download - page 335
Download and view the complete annual report
Please find page 335 of the 2009 RBS annual report below. You can navigate through the pages in the report by either clicking on the pages listed below, or by using the keyword search tool below to find specific information within the annual report.-
 1
1 -
2
-
3
-
4
-
5
-
6
-
7
-
8
-
9
-
10
-
11
-
12
-
13
-
14
-
15
-
16
-
17
-
18
-
19
-
20
-
21
-
22
-
23
-
24
-
25
-
26
-
27
-
28
-
29
-
30
-
31
-
32
-
33
-
34
-
35
-
36
-
37
-
38
-
39
-
40
-
41
-
42
-
43
-
44
-
45
-
46
-
47
-
48
-
49
-
50
-
51
-
52
-
53
-
54
-
55
-
56
-
57
-
58
-
59
-
60
-
61
-
62
-
63
-
64
-
65
-
66
-
67
-
68
-
69
-
70
-
71
-
72
-
73
-
74
-
75
-
76
-
77
-
78
-
79
-
80
-
81
-
82
-
83
-
84
-
85
-
86
-
87
-
88
-
89
-
90
-
91
-
92
-
93
-
94
-
95
-
96
-
97
-
98
-
99
-
100
-
101
-
102
-
103
-
104
-
105
-
106
-
107
-
108
-
109
-
110
-
111
-
112
-
113
-
114
-
115
-
116
-
117
-
118
-
119
-
120
-
121
-
122
-
123
-
124
-
125
-
126
-
127
-
128
-
129
-
130
-
131
-
132
-
133
-
134
-
135
-
136
-
137
-
138
-
139
-
140
-
141
-
142
-
143
-
144
-
145
-
146
-
147
-
148
-
149
-
150
-
151
-
152
-
153
-
154
-
155
-
156
-
157
-
158
-
159
-
160
-
161
-
162
-
163
-
164
-
165
-
166
-
167
-
168
-
169
-
170
-
171
-
172
-
173
-
174
-
175
-
176
-
177
-
178
-
179
-
180
-
181
-
182
-
183
-
184
-
185
-
186
-
187
-
188
-
189
-
190
-
191
-
192
-
193
-
194
-
195
-
196
-
197
-
198
-
199
-
200
-
201
-
202
-
203
-
204
-
205
-
206
-
207
-
208
-
209
-
210
-
211
-
212
-
213
-
214
-
215
-
216
-
217
-
218
-
219
-
220
-
221
-
222
-
223
-
224
-
225
-
226
-
227
-
228
-
229
-
230
-
231
-
232
-
233
-
234
-
235
-
236
-
237
-
238
-
239
-
240
-
241
-
242
-
243
-
244
-
245
-
246
-
247
-
248
-
249
-
250
-
251
-
252
-
253
-
254
-
255
-
256
-
257
-
258
-
259
-
260
-
261
-
262
-
263
-
264
-
265
-
266
-
267
-
268
-
269
-
270
-
271
-
272
-
273
-
274
-
275
-
276
-
277
-
278
-
279
-
280
-
281
-
282
-
283
-
284
-
285
-
286
-
287
-
288
-
289
-
290
-
291
-
292
-
293
-
294
-
295
-
296
-
297
-
298
-
299
-
300
-
301
-
302
-
303
-
304
-
305
-
306
-
307
-
308
-
309
-
310
-
311
-
312
-
313
-
314
-
315
-
316
-
317
-
318
-
319
-
320
-
321
-
322
-
323
-
324
-
 325
325 -
 326
326 -
 327
327 -
 328
328 -
 329
329 -
 330
330 -
 331
331 -
 332
332 -
 333
333 -
 334
334 -
 335
335 -
 336
336 -
 337
337 -
 338
338 -
 339
339 -
 340
340 -
 341
341 -
 342
342 -
 343
343 -
 344
344 -
 345
345 -
346
-
347
-
348
-
349
-
350
-
351
-
352
-
353
-
354
-
355
-
356
-
357
-
358
-
359
-
360
-
361
-
362
-
363
-
364
-
365
-
366
-
367
-
368
-
369
-
370
-
371
-
372
-
373
-
374
-
375
-
376
-
377
-
378
-
379
-
380
-
381
-
382
-
383
-
384
-
385
-
386
-
387
-
388
-
389
-
390
 |
 |

333RBS Group Annual Report and Accounts 2009
Financial statements
Notes on the accounts
Trustee and other fiduciary activities
In its capacity as trustee or other fiduciary role, the Group may hold
or place assets on behalf of individuals, trusts, companies, pension
schemes and others. The assets and their income are not included
in the Group’s financial statements. The Group earned fee income
of £1,355 million (2008 – £1,442 million; 2007 – £695 million) from
these activities.
The Financial Services Compensation Scheme
The Financial Services Compensation Scheme (FSCS), the UK's
statutory fund of last resort for customers of authorised financial
services firms, pays compensation if a firm is unable to meet its
obligations. The FSCS funds compensation for customers by raising
management expenses levies and compensation levies on the industry.
In relation to protected deposits, each deposit-taking institution
contributes towards these levies in proportion to their share of total
protected deposits on 31 December of the year preceding the scheme
year (which runs from 1 April to 31 March), subject to annual maxima
set by the Financial Services Authority (FSA). In addition, the FSCS has
the power to raise levies (‘exit levies’) on firms who have ceased to
participate in the scheme and are in the process of ceasing to be
authorised for the amount that the firm would otherwise have been
asked to pay during the relevant levy year. The FSCS also has the power
to raise exit levies on such firms which look at their potential liability to
pay levies in future years.
FSCS has borrowed from HM Treasury to fund the compensation costs
associated with Bradford & Bingley, Heritable Bank, Kaupthing Singer &
Friedlander, Landsbanki ‘Icesave’ and London Scottish Bank plc. These
borrowings are on an interest-only basis until September 2011. The
annual limit on the FSCS management expenses levy for the three years
from September 2008 in relation to these institutions has been capped
at £1 billion per annum.
The FSCS will receive funds from asset sales, surplus cash flow, or other
recoveries in relation to these institutions which will be used to reduce
the principal amount of the FSCS's borrowings. Only after the interest
only period, which is expected to end in September 2011, will a schedule
for repayment of any remaining principal outstanding (after recoveries)
on the borrowings be agreed between the FSCS and HM Treasury. It is
expected that, from that point, the FSCS will begin to raise compensation
levies (principal repayments). No provision has been made for these
levies as the amount is not yet known and is unlikely to be determined
before 2011.
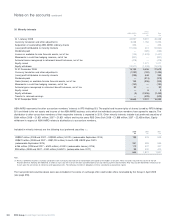
The Group has accrued £135 million for its share of FSCS management
expenses levies for the 2009/10 and 2010/11 scheme years.
Litigation
As a participant in the financial services industry, the Group operates in
a legal and regulatory environment that exposes it to potentially
significant litigation risks. As a result, the company and other members
of the Group are involved in various disputes and legal proceedings in
the United Kingdom, the United States and other jurisdictions, including
litigation. Such cases are subject to many uncertainties, and their
outcome is often difficult to predict, particularly in the earlier stages of a
case.
Other than as set out in this section, so far as the Group is aware,
neither the company nor any member of the Group is or has been
engaged in or has pending or threatened any governmental, legal or
arbitration proceedings which may have or have had in the recent past
(covering the 12 months immediately preceding the date of this
document) a significant effect on the Group’s financial position or
profitability.
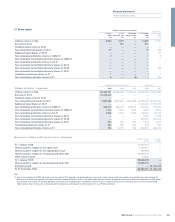
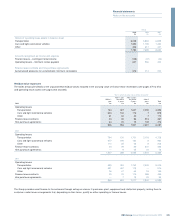
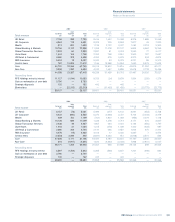
Group
2009 2008 2007
£m £m £m
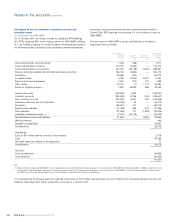
Operating leases
Minimum rentals payable under non-cancellable leases (1)
Within 1 year 479 579 359
After 1 year but within 5 years 1,691 1,727 1,224
After 5 years 3,055 3,299 3,017
5,225 5,605 4,600
Property, plant and equipment
Contracts to buy, enhance or maintain investment properties — 79
Contracts to buy assets to be leased under operating leases (2) 2,724 6,063 1,350
Other capital expenditure 89 128 201
2,813 6,198 1,560
Contracts to purchase goods or services (3) 665 2,127 1,598
Total 8,703 13,930 7,758
Notes:
(1) Predominantly property leases
(2) Of which due within 1 year: £370 million (2008 – £3,769 million; 2007 – £713 million)
(3) Of which due within 1 year: £480 million (2008 – £1,129 million; 2007 – £1,448 million)
Contractual obligations for future expenditure not provided in the accounts
The following table shows contractual obligations for future expenditure not provided for in the accounts at the year end.