RBS 2009 Annual Report Download - page 298
Download and view the complete annual report
Please find page 298 of the 2009 RBS annual report below. You can navigate through the pages in the report by either clicking on the pages listed below, or by using the keyword search tool below to find specific information within the annual report.-
 1
1 -
2
-
3
-
4
-
5
-
6
-
7
-
8
-
9
-
10
-
11
-
12
-
13
-
14
-
15
-
16
-
17
-
18
-
19
-
20
-
21
-
22
-
23
-
24
-
25
-
26
-
27
-
28
-
29
-
30
-
31
-
32
-
33
-
34
-
35
-
36
-
37
-
38
-
39
-
40
-
41
-
42
-
43
-
44
-
45
-
46
-
47
-
48
-
49
-
50
-
51
-
52
-
53
-
54
-
55
-
56
-
57
-
58
-
59
-
60
-
61
-
62
-
63
-
64
-
65
-
66
-
67
-
68
-
69
-
70
-
71
-
72
-
73
-
74
-
75
-
76
-
77
-
78
-
79
-
80
-
81
-
82
-
83
-
84
-
85
-
86
-
87
-
88
-
89
-
90
-
91
-
92
-
93
-
94
-
95
-
96
-
97
-
98
-
99
-
100
-
101
-
102
-
103
-
104
-
105
-
106
-
107
-
108
-
109
-
110
-
111
-
112
-
113
-
114
-
115
-
116
-
117
-
118
-
119
-
120
-
121
-
122
-
123
-
124
-
125
-
126
-
127
-
128
-
129
-
130
-
131
-
132
-
133
-
134
-
135
-
136
-
137
-
138
-
139
-
140
-
141
-
142
-
143
-
144
-
145
-
146
-
147
-
148
-
149
-
150
-
151
-
152
-
153
-
154
-
155
-
156
-
157
-
158
-
159
-
160
-
161
-
162
-
163
-
164
-
165
-
166
-
167
-
168
-
169
-
170
-
171
-
172
-
173
-
174
-
175
-
176
-
177
-
178
-
179
-
180
-
181
-
182
-
183
-
184
-
185
-
186
-
187
-
188
-
189
-
190
-
191
-
192
-
193
-
194
-
195
-
196
-
197
-
198
-
199
-
200
-
201
-
202
-
203
-
204
-
205
-
206
-
207
-
208
-
209
-
210
-
211
-
212
-
213
-
214
-
215
-
216
-
217
-
218
-
219
-
220
-
221
-
222
-
223
-
224
-
225
-
226
-
227
-
228
-
229
-
230
-
231
-
232
-
233
-
234
-
235
-
236
-
237
-
238
-
239
-
240
-
241
-
242
-
243
-
244
-
245
-
246
-
247
-
248
-
249
-
250
-
251
-
252
-
253
-
254
-
255
-
256
-
257
-
258
-
259
-
260
-
261
-
262
-
263
-
264
-
265
-
266
-
267
-
268
-
269
-
270
-
271
-
272
-
273
-
274
-
275
-
276
-
277
-
278
-
279
-
280
-
281
-
282
-
283
-
284
-
285
-
286
-
287
-
 288
288 -
 289
289 -
 290
290 -
 291
291 -
 292
292 -
 293
293 -
 294
294 -
 295
295 -
 296
296 -
 297
297 -
 298
298 -
 299
299 -
 300
300 -
 301
301 -
 302
302 -
 303
303 -
 304
304 -
 305
305 -
 306
306 -
 307
307 -
 308
308 -
309
-
310
-
311
-
312
-
313
-
314
-
315
-
316
-
317
-
318
-
319
-
320
-
321
-
322
-
323
-
324
-
325
-
326
-
327
-
328
-
329
-
330
-
331
-
332
-
333
-
334
-
335
-
336
-
337
-
338
-
339
-
340
-
341
-
342
-
343
-
344
-
345
-
346
-
347
-
348
-
349
-
350
-
351
-
352
-
353
-
354
-
355
-
356
-
357
-
358
-
359
-
360
-
361
-
362
-
363
-
364
-
365
-
366
-
367
-
368
-
369
-
370
-
371
-
372
-
373
-
374
-
375
-
376
-
377
-
378
-
379
-
380
-
381
-
382
-
383
-
384
-
385
-
386
-
387
-
388
-
389
-
390
 |
 |

Notes on the accounts continued
RBS Group Annual Report and Accounts 2009296
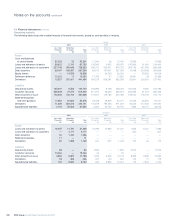
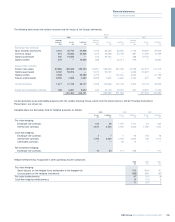
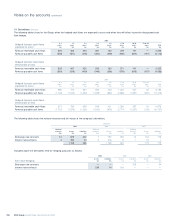
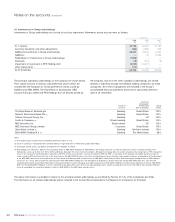
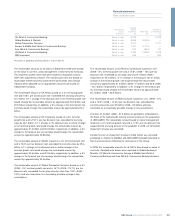
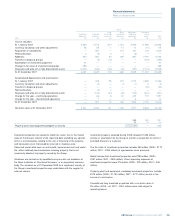
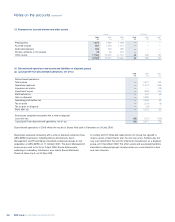
13 Derivatives continued
The following tables show, for the Group, when the hedged cash flows are expected to occur and when they will affect income for designated cash
flow hedges.
2009
0-1 1-2 2-3 3-4 4-5 5-10 10-20 Over 20
Hedged forecast cash flows years years years years years years years years Total
expected to occur £m £m £m £m £m £m £m £m £m
Forecast receivable cash flows 504 466 423 267 163 379 141 — 2,343
Forecast payable cash flows (554) (521) (416) (350) (299) (990) (819) (167) (4,116)
Hedged forecast cash flows
affect profit or loss
Forecast receivable cash flows 503 467 422 255 163 371 141 — 2,322
Forecast payable cash flows (554) (518) (409) (346) (296) (978) (818) (167) (4,086)
2008
0-1 1-2 2-3 3-4 4-5 5-10 10-20 Over 20
Hedged forecast cash flows years years years years years years years years Total
expected to occur £m £m £m £m £m £m £m £m £m
Forecast receivable cash flows 985 779 667 554 423 1,323 407 45 5,183
Forecast payable cash flows (1,732) (1,614) (1,390) (1,059) (890) (2,880) (1,397) (257) (11,219)
Hedged forecast cash flows
affect profit or loss
Forecast receivable cash flows 871 758 659 548 421 1,284 397 40 4,978
Forecast payable cash flows (1,701) (1,576) (1,323) (1,023) (878) (2,771) (1,337) (128) (10,737)
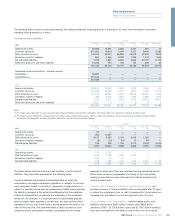
The following table shows the notional amounts and fair values of the company’s derivatives.
Company
2009 2008 2007
Notional Notional Notional
amounts Assets Liabilities amounts Assets Liabilities amounts Assets Liabilities
£bn £m £m £bn £m £m £bn £m £m
Exchange rate contracts 10 875 422 7 792 353 13 154 178
Interest rate contracts 4 294 24 5 376 8 1 19 1
1,169 446 1,168 361 173 179
Included above are derivatives held for hedging purposes as follows:
2009 2008 2007
Assets Liabilities Assets Liabilities Assets Liabilities
Fair value hedging £m £m £m £m £m £m
Exchange rate contracts — — — 225 — 54
Interest rate contracts 239 14 193 — — —