RBS 2009 Annual Report Download - page 137
Download and view the complete annual report
Please find page 137 of the 2009 RBS annual report below. You can navigate through the pages in the report by either clicking on the pages listed below, or by using the keyword search tool below to find specific information within the annual report.-
 1
1 -
2
-
3
-
4
-
5
-
6
-
7
-
8
-
9
-
10
-
11
-
12
-
13
-
14
-
15
-
16
-
17
-
18
-
19
-
20
-
21
-
22
-
23
-
24
-
25
-
26
-
27
-
28
-
29
-
30
-
31
-
32
-
33
-
34
-
35
-
36
-
37
-
38
-
39
-
40
-
41
-
42
-
43
-
44
-
45
-
46
-
47
-
48
-
49
-
50
-
51
-
52
-
53
-
54
-
55
-
56
-
57
-
58
-
59
-
60
-
61
-
62
-
63
-
64
-
65
-
66
-
67
-
68
-
69
-
70
-
71
-
72
-
73
-
74
-
75
-
76
-
77
-
78
-
79
-
80
-
81
-
82
-
83
-
84
-
85
-
86
-
87
-
88
-
89
-
90
-
91
-
92
-
93
-
94
-
95
-
96
-
97
-
98
-
99
-
100
-
101
-
102
-
103
-
104
-
105
-
106
-
107
-
108
-
109
-
110
-
111
-
112
-
113
-
114
-
115
-
116
-
117
-
118
-
119
-
120
-
121
-
122
-
123
-
124
-
125
-
126
-
 127
127 -
 128
128 -
 129
129 -
 130
130 -
 131
131 -
 132
132 -
 133
133 -
 134
134 -
 135
135 -
 136
136 -
 137
137 -
 138
138 -
 139
139 -
 140
140 -
 141
141 -
 142
142 -
 143
143 -
 144
144 -
 145
145 -
 146
146 -
 147
147 -
148
-
149
-
150
-
151
-
152
-
153
-
154
-
155
-
156
-
157
-
158
-
159
-
160
-
161
-
162
-
163
-
164
-
165
-
166
-
167
-
168
-
169
-
170
-
171
-
172
-
173
-
174
-
175
-
176
-
177
-
178
-
179
-
180
-
181
-
182
-
183
-
184
-
185
-
186
-
187
-
188
-
189
-
190
-
191
-
192
-
193
-
194
-
195
-
196
-
197
-
198
-
199
-
200
-
201
-
202
-
203
-
204
-
205
-
206
-
207
-
208
-
209
-
210
-
211
-
212
-
213
-
214
-
215
-
216
-
217
-
218
-
219
-
220
-
221
-
222
-
223
-
224
-
225
-
226
-
227
-
228
-
229
-
230
-
231
-
232
-
233
-
234
-
235
-
236
-
237
-
238
-
239
-
240
-
241
-
242
-
243
-
244
-
245
-
246
-
247
-
248
-
249
-
250
-
251
-
252
-
253
-
254
-
255
-
256
-
257
-
258
-
259
-
260
-
261
-
262
-
263
-
264
-
265
-
266
-
267
-
268
-
269
-
270
-
271
-
272
-
273
-
274
-
275
-
276
-
277
-
278
-
279
-
280
-
281
-
282
-
283
-
284
-
285
-
286
-
287
-
288
-
289
-
290
-
291
-
292
-
293
-
294
-
295
-
296
-
297
-
298
-
299
-
300
-
301
-
302
-
303
-
304
-
305
-
306
-
307
-
308
-
309
-
310
-
311
-
312
-
313
-
314
-
315
-
316
-
317
-
318
-
319
-
320
-
321
-
322
-
323
-
324
-
325
-
326
-
327
-
328
-
329
-
330
-
331
-
332
-
333
-
334
-
335
-
336
-
337
-
338
-
339
-
340
-
341
-
342
-
343
-
344
-
345
-
346
-
347
-
348
-
349
-
350
-
351
-
352
-
353
-
354
-
355
-
356
-
357
-
358
-
359
-
360
-
361
-
362
-
363
-
364
-
365
-
366
-
367
-
368
-
369
-
370
-
371
-
372
-
373
-
374
-
375
-
376
-
377
-
378
-
379
-
380
-
381
-
382
-
383
-
384
-
385
-
386
-
387
-
388
-
389
-
390
 |
 |

Business review
Risk, capital and liquidity management
135RBS Group Annual Report and Accounts 2009
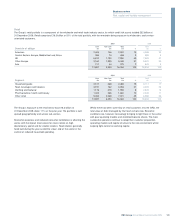
UK residential mortgages
The UK mortgage portfolio totalled £85.5 billion at 31 December 2009,
an increase of 15% from 31 December 2008, due to strong sales
growth and lower redemption rates. Of the total portfolio, 98% is
designated as Core business with the primary brands being the Royal
Bank of Scotland, NatWest, the One Account and First Active. The
assets comprise prime mortgage lending and include 6.6% (£5.6 billion)
of exposure to residential buy-to-let. There is a small legacy self
certification book (0.4% of total assets); which was withdrawn from sale
in 2004.
UK net new mortgage lending in 2009 was strong at £11 billion and the
Group has exceeded its commitment to the UK Government on net
mortgage lending. The average LTV for new business during 2009 was
unchanged at 67.2%. The maximum LTV available to new customers
remains at 90%.
The arrears rate (three or more payments missed) on the combined
Royal Bank of Scotland and NatWest brands was 1.8% at 31 December
2009. After a period of deterioration driven by the economic environment
this stabilised in the second half of 2009 (arrears rate stood at 1.8% at
30 June 2009 and 1.5% at 31 December 2008). The arrears rate on the
buy-to-let portfolio was 1.6% at 31 December 2009 (1.6% at 30 June
2009 and 1.5% at 31 December 2008).
The mortgage impairment charge was £129 million in 2009, compared
with £33 million in 2008, attributable to declining house prices driving
lower recoveries and an increase in defaults reflecting the difficult
economic environment. Default rates remain sensitive to economic
developments, notably unemployment rates. Provision as a proportion
of balances at 31 December 2009 were 0.3% and 0.2% at 31
December 2008.
A number of initiatives aimed at increasing the levels of support to
customers experiencing difficulties were implemented in 2008 and will
continue in 2010. The Group does not initiate repossession proceedings
for at least six months after arrears are evident and participates in
various government-led initiatives such as the mortgage rescue scheme
and homeowner mortgage support.
Ulster Bank residential mortgages
The residential mortgage portfolio across the Ulster Bank and First Active
brands totalled £22.3 billion at 31 December 2009; 91% is in the Republic
of Ireland and 9% in Northern Ireland. This represents a decline of 4% in
the Republic of Ireland and an increase of 13% in Northern Ireland from
31 December 2008. 27% of the portfolio is Non-Core.
The arrears rate increased to 3.3% at 31 December 2009 from 1.6% at 31
December 2008. As a result, the impairment charge for 2009 was £115
million versus £23 million for 2008. Repossessions totalled 96 in 2009,
compared with 37 in 2008 with the majority of these being voluntary.
During 2009 new business originations in the Republic of Ireland were
very low across all segments. The bank introduced new products –
Momentum and SecureStep – in both Northern Ireland and the Republic
of Ireland which aim to support market activity for new build properties.
In Northern Ireland, lending increased in the second half of 2009 as a
degree of confidence returned to the property market.
Citizens real estate
Citizens total residential real estate portfolio totalled $42 billion at 31
December 2009 (2008 – $50 billion). The real estate portfolio comprises
$11 billion of first lien mortgages and $31 billion of home equity loans
and lines (Core portfolio 48% first lien). 83% of the portfolio is Core
business; $10 billion of mortgages and $25 billion of home equity loans
and lines (48% of the latter being first lien). The serviced by others
(SBO) portfolio (96% second lien) is the largest component of the Non-
Core portfolio.
Citizens has focused its origination efforts in the more mature and stable
markets of New England and Mid Atlantic (Citizen’s ‘footprint states’),
targeting low risk products and adopting conservative risk policies.
Loan acceptance criteria were tightened during 2009 to address
deteriorating economic and market conditions. At 31 December 2009,
the portfolio consisted of $34 billion (80% of the total portfolio) in these
footprint states.
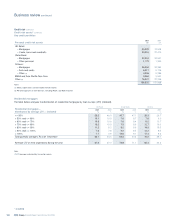
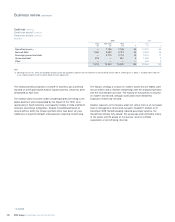
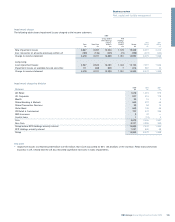
The table below details residential mortgages three months or more in arrears (by volume).
2009 2008
%%
UK Retail (1) 1.8 1.5
Ulster Bank 3.3 1.6
Citizens 1.5 0.9
Note:
(1) UK Retail analysis covers the Royal Bank and NatWest brands and covers 77% of the UK Retail mortgage portfolio (the remainder operates under the same credit policies).