RBS 2009 Annual Report Download - page 205
Download and view the complete annual report
Please find page 205 of the 2009 RBS annual report below. You can navigate through the pages in the report by either clicking on the pages listed below, or by using the keyword search tool below to find specific information within the annual report.-
 1
1 -
2
-
3
-
4
-
5
-
6
-
7
-
8
-
9
-
10
-
11
-
12
-
13
-
14
-
15
-
16
-
17
-
18
-
19
-
20
-
21
-
22
-
23
-
24
-
25
-
26
-
27
-
28
-
29
-
30
-
31
-
32
-
33
-
34
-
35
-
36
-
37
-
38
-
39
-
40
-
41
-
42
-
43
-
44
-
45
-
46
-
47
-
48
-
49
-
50
-
51
-
52
-
53
-
54
-
55
-
56
-
57
-
58
-
59
-
60
-
61
-
62
-
63
-
64
-
65
-
66
-
67
-
68
-
69
-
70
-
71
-
72
-
73
-
74
-
75
-
76
-
77
-
78
-
79
-
80
-
81
-
82
-
83
-
84
-
85
-
86
-
87
-
88
-
89
-
90
-
91
-
92
-
93
-
94
-
95
-
96
-
97
-
98
-
99
-
100
-
101
-
102
-
103
-
104
-
105
-
106
-
107
-
108
-
109
-
110
-
111
-
112
-
113
-
114
-
115
-
116
-
117
-
118
-
119
-
120
-
121
-
122
-
123
-
124
-
125
-
126
-
127
-
128
-
129
-
130
-
131
-
132
-
133
-
134
-
135
-
136
-
137
-
138
-
139
-
140
-
141
-
142
-
143
-
144
-
145
-
146
-
147
-
148
-
149
-
150
-
151
-
152
-
153
-
154
-
155
-
156
-
157
-
158
-
159
-
160
-
161
-
162
-
163
-
164
-
165
-
166
-
167
-
168
-
169
-
170
-
171
-
172
-
173
-
174
-
175
-
176
-
177
-
178
-
179
-
180
-
181
-
182
-
183
-
184
-
185
-
186
-
187
-
188
-
189
-
190
-
191
-
192
-
193
-
194
-
 195
195 -
 196
196 -
 197
197 -
 198
198 -
 199
199 -
 200
200 -
 201
201 -
 202
202 -
 203
203 -
 204
204 -
 205
205 -
 206
206 -
 207
207 -
 208
208 -
 209
209 -
 210
210 -
 211
211 -
 212
212 -
 213
213 -
 214
214 -
 215
215 -
216
-
217
-
218
-
219
-
220
-
221
-
222
-
223
-
224
-
225
-
226
-
227
-
228
-
229
-
230
-
231
-
232
-
233
-
234
-
235
-
236
-
237
-
238
-
239
-
240
-
241
-
242
-
243
-
244
-
245
-
246
-
247
-
248
-
249
-
250
-
251
-
252
-
253
-
254
-
255
-
256
-
257
-
258
-
259
-
260
-
261
-
262
-
263
-
264
-
265
-
266
-
267
-
268
-
269
-
270
-
271
-
272
-
273
-
274
-
275
-
276
-
277
-
278
-
279
-
280
-
281
-
282
-
283
-
284
-
285
-
286
-
287
-
288
-
289
-
290
-
291
-
292
-
293
-
294
-
295
-
296
-
297
-
298
-
299
-
300
-
301
-
302
-
303
-
304
-
305
-
306
-
307
-
308
-
309
-
310
-
311
-
312
-
313
-
314
-
315
-
316
-
317
-
318
-
319
-
320
-
321
-
322
-
323
-
324
-
325
-
326
-
327
-
328
-
329
-
330
-
331
-
332
-
333
-
334
-
335
-
336
-
337
-
338
-
339
-
340
-
341
-
342
-
343
-
344
-
345
-
346
-
347
-
348
-
349
-
350
-
351
-
352
-
353
-
354
-
355
-
356
-
357
-
358
-
359
-
360
-
361
-
362
-
363
-
364
-
365
-
366
-
367
-
368
-
369
-
370
-
371
-
372
-
373
-
374
-
375
-
376
-
377
-
378
-
379
-
380
-
381
-
382
-
383
-
384
-
385
-
386
-
387
-
388
-
389
-
390
 |
 |

Business review
Risk, capital and liquidity management
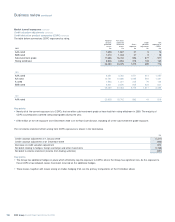
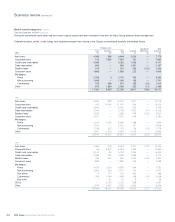
203RBS Group Annual Report and Accounts 2009
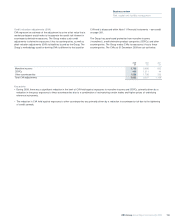
2009
Core Non-Core Total 2008 2007
£m £m £m £m £m
Total assets held by the conduits 23,409 3,957 27,366 49,857 48,070
Commercial paper issued 22,644 2,939 25,583 48,684 46,532
Liquidity and credit enhancements:
Deal specific liquidity:
drawn 738 1,059 1,797 1,172 1,537
undrawn 28,628 3,852 32,480 57,929 61,347
Programme-wide liquidity: undrawn — — — —75
PWCE (1) 1,167 341 1,508 2,391 3,096
30,533 5,252 35,785 61,492 66,055
Maximum exposure to loss (2) 29,365 4,911 34,276 59,101 62,959
Notes:
(1) Programme-wide credit enhancement.
(2) Maximum exposure to loss is determined as the Group’s total liquidity commitments to the conduits and additionally programme-wide credit support which would absorb first loss on transactions
where liquidity support is provided by a third party. Third party maximum exposure to loss is reduced by repo trades conducted with an external counterparty.
The third-party assets financed by the conduits receive credit
enhancement from the originators of the assets. This credit
enhancement, which is specific to each transaction can take the form of
over-collateralisation, excess spread or subordinated loan, and typically
ensures the asset acquired by the conduit has a rating equivalent to at
least a single-A credit. In addition, in line with general market practice,
the Group provides a small second-loss layer of programme-wide
protection to the multi-seller conduits. Given the nature and investment
grade equivalent quality of the first loss enhancement provided by the
originators of the assets, the Group has only a minimal risk of loss on its
programme-wide exposure. The issued ABCP is rated A-1/P-1 by
Moody’s and Standard & Poor’s.
The Group provides liquidity back-up facilities to the conduits it
sponsors. The conduits are able to draw funding under these facilities in
the event of a disruption in the ABCP market, or when certain trigger
events prevent the issue of ABCP.
Key points
•The maturity of commercial paper issued by the Group’s conduits is
managed to mitigate the short-term contingent liquidity risk of
providing back-up facilities. The Group’s limits sanctioned for such
liquidity facilities at 31 December 2009 totalled approximately
£25.0 billion (2008 – £42.9 billion). For a very small number of
transactions within one multi-seller conduit the liquidity facilities have
been provided by third-party banks. This typically occurs on
transactions where the third-party bank does not use, or have, its own
conduit vehicles.
•The Group’s maximum exposure to loss on its multi-seller conduits is
£25.2 billion (2008 – £43.2 billion), being the total amount of the
Group’s liquidity commitments plus the extent of programme-wide
credit enhancements of conduit assets for which liquidity facilities
were provided by third parties.
•The Group’s multi-seller conduits have continued to fund the vast
majority of their assets solely through ABCP issuance. There have
been no significant systemic failures within the financial markets
similar to that experienced in the second half of 2008 following
Lehman Brothers bankruptcy filing in September 2008. The
improvement in market conditions has allowed these conduits to move
towards more normal ABCP funding and reduced the need for
backstop funding from the Group.
Group-sponsored own-asset conduits
The Group’s own-asset conduit programmes have been established to
diversify the Group’s funding sources. The conduits allow the Group to
access central government funding schemes and the ABCP market.
The Group holds three own-asset conduits which have assets that have
previously been funded by the Group. These vehicles represent 56%
(2008 – 25%) of the Group’s conduit business (as a percentage of
the total liquidity and credit enhancements committed by the Group),
with £7.7 billion of ABCP outstanding at 31 December 2009
(2008 – £14.8 billion). The Group’s maximum exposure to loss on its
own-asset conduits is £34.2 billion (2008 – £15.9 billion), being the total
drawn and undrawn amount of the Group’s liquidity commitments to
these conduits. This comprises committed liquidity of $40.8 billion
(£25.1 billion) to an own-asset conduit established to access the Bank
of England’s open market operations and £9.1 billion to other own-asset
conduits. As the first of these conduits was established for contingent
funding and at 31 December 2009 it had no commercial paper
outstanding, the Group’s liquidity commitment to this conduit is not
included in the table below.
Group exposure to consolidated conduits
The exposure to conduits which are consolidated by the Group is set
out below.