RBS 2009 Annual Report Download - page 272
Download and view the complete annual report
Please find page 272 of the 2009 RBS annual report below. You can navigate through the pages in the report by either clicking on the pages listed below, or by using the keyword search tool below to find specific information within the annual report.-
 1
1 -
2
-
3
-
4
-
5
-
6
-
7
-
8
-
9
-
10
-
11
-
12
-
13
-
14
-
15
-
16
-
17
-
18
-
19
-
20
-
21
-
22
-
23
-
24
-
25
-
26
-
27
-
28
-
29
-
30
-
31
-
32
-
33
-
34
-
35
-
36
-
37
-
38
-
39
-
40
-
41
-
42
-
43
-
44
-
45
-
46
-
47
-
48
-
49
-
50
-
51
-
52
-
53
-
54
-
55
-
56
-
57
-
58
-
59
-
60
-
61
-
62
-
63
-
64
-
65
-
66
-
67
-
68
-
69
-
70
-
71
-
72
-
73
-
74
-
75
-
76
-
77
-
78
-
79
-
80
-
81
-
82
-
83
-
84
-
85
-
86
-
87
-
88
-
89
-
90
-
91
-
92
-
93
-
94
-
95
-
96
-
97
-
98
-
99
-
100
-
101
-
102
-
103
-
104
-
105
-
106
-
107
-
108
-
109
-
110
-
111
-
112
-
113
-
114
-
115
-
116
-
117
-
118
-
119
-
120
-
121
-
122
-
123
-
124
-
125
-
126
-
127
-
128
-
129
-
130
-
131
-
132
-
133
-
134
-
135
-
136
-
137
-
138
-
139
-
140
-
141
-
142
-
143
-
144
-
145
-
146
-
147
-
148
-
149
-
150
-
151
-
152
-
153
-
154
-
155
-
156
-
157
-
158
-
159
-
160
-
161
-
162
-
163
-
164
-
165
-
166
-
167
-
168
-
169
-
170
-
171
-
172
-
173
-
174
-
175
-
176
-
177
-
178
-
179
-
180
-
181
-
182
-
183
-
184
-
185
-
186
-
187
-
188
-
189
-
190
-
191
-
192
-
193
-
194
-
195
-
196
-
197
-
198
-
199
-
200
-
201
-
202
-
203
-
204
-
205
-
206
-
207
-
208
-
209
-
210
-
211
-
212
-
213
-
214
-
215
-
216
-
217
-
218
-
219
-
220
-
221
-
222
-
223
-
224
-
225
-
226
-
227
-
228
-
229
-
230
-
231
-
232
-
233
-
234
-
235
-
236
-
237
-
238
-
239
-
240
-
241
-
242
-
243
-
244
-
245
-
246
-
247
-
248
-
249
-
250
-
251
-
252
-
253
-
254
-
255
-
256
-
257
-
258
-
259
-
260
-
261
-
 262
262 -
 263
263 -
 264
264 -
 265
265 -
 266
266 -
 267
267 -
 268
268 -
 269
269 -
 270
270 -
 271
271 -
 272
272 -
 273
273 -
 274
274 -
 275
275 -
 276
276 -
 277
277 -
 278
278 -
 279
279 -
 280
280 -
 281
281 -
 282
282 -
283
-
284
-
285
-
286
-
287
-
288
-
289
-
290
-
291
-
292
-
293
-
294
-
295
-
296
-
297
-
298
-
299
-
300
-
301
-
302
-
303
-
304
-
305
-
306
-
307
-
308
-
309
-
310
-
311
-
312
-
313
-
314
-
315
-
316
-
317
-
318
-
319
-
320
-
321
-
322
-
323
-
324
-
325
-
326
-
327
-
328
-
329
-
330
-
331
-
332
-
333
-
334
-
335
-
336
-
337
-
338
-
339
-
340
-
341
-
342
-
343
-
344
-
345
-
346
-
347
-
348
-
349
-
350
-
351
-
352
-
353
-
354
-
355
-
356
-
357
-
358
-
359
-
360
-
361
-
362
-
363
-
364
-
365
-
366
-
367
-
368
-
369
-
370
-
371
-
372
-
373
-
374
-
375
-
376
-
377
-
378
-
379
-
380
-
381
-
382
-
383
-
384
-
385
-
386
-
387
-
388
-
389
-
390
 |
 |

Notes on the accounts continued
RBS Group Annual Report and Accounts 2009270
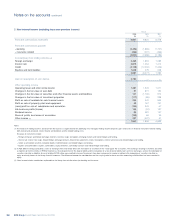
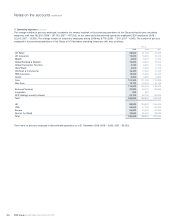
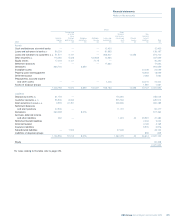
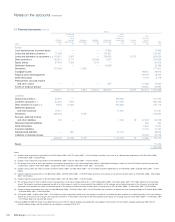
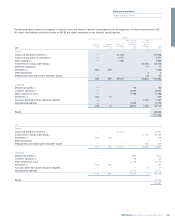
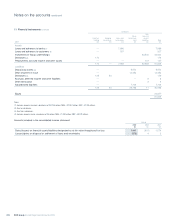
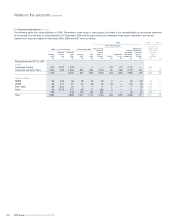
11 Financial instruments
Classification
The following tables analyse the Group’s financial assets and financial liabilities in accordance with the categories of financial instruments in IAS 39.
Assets and liabilities outside the scope of IAS 39 are shown separately.
Group
Designated Other
as at fair financial Non
value instruments financial
Held-for- through Hedging Available- Loans and (amortised Finance assets/
trading profit or loss derivatives for-sale receivables cost) leases liabilities Total
2009 £m £m £m £m £m £m £m £m £m
Assets
Cash and balances at central banks — — — 52,261 52,261
Loans and advances to banks (1) 45,449 — — 46,304 91,753
Loans and advances to customers (2, 3) 42,277 1,981 — 671,037 13,098 728,393
Debt securities (4) 111,482 2,603 143,298 9,871 267,254
Equity shares 14,443 2,192 2,893 — 19,528
Settlement balances — — — 12,033 12,033
Derivatives 436,857 4,597 441,454
Intangible assets 17,847 17,847
Property, plant and equipment 19,397 19,397
Deferred taxation 7,039 7,039
Prepayments, accrued income
and other assets — — — 1,421 19,564 20,985
Assets of disposal groups 18,542 18,542
650,508 6,776 4,597 146,191 792,927 13,098 82,389 1,696,486
Liabilities
Deposits by banks (5) 53,609 — 88,535 142,144
Customer accounts (6, 7) 52,868 8,580 552,754 614,202
Debt securities in issue (8, 9) 3,925 41,537 222,106 267,568
Settlement balances
and short positions 40,463 — 10,413 50,876
Derivatives 417,634 6,507 424,141
Accruals, deferred income
and other liabilities — — 1,889 467 27,971 30,327
Retirement benefit liabilities 2,963 2,963
Deferred taxation 2,811 2,811
Insurance liabilities 10,281 10,281
Subordinated liabilities — 1,277 36,375 37,652
Liabilities of disposal groups 18,890 18,890
568,499 51,394 6,507 — — 912,072 467 62,916 1,601,855
Equity 94,631
1,696,486
For notes relating to this table refer to page 272.