RBS 2009 Annual Report Download - page 154
Download and view the complete annual report
Please find page 154 of the 2009 RBS annual report below. You can navigate through the pages in the report by either clicking on the pages listed below, or by using the keyword search tool below to find specific information within the annual report.-
 1
1 -
2
-
3
-
4
-
5
-
6
-
7
-
8
-
9
-
10
-
11
-
12
-
13
-
14
-
15
-
16
-
17
-
18
-
19
-
20
-
21
-
22
-
23
-
24
-
25
-
26
-
27
-
28
-
29
-
30
-
31
-
32
-
33
-
34
-
35
-
36
-
37
-
38
-
39
-
40
-
41
-
42
-
43
-
44
-
45
-
46
-
47
-
48
-
49
-
50
-
51
-
52
-
53
-
54
-
55
-
56
-
57
-
58
-
59
-
60
-
61
-
62
-
63
-
64
-
65
-
66
-
67
-
68
-
69
-
70
-
71
-
72
-
73
-
74
-
75
-
76
-
77
-
78
-
79
-
80
-
81
-
82
-
83
-
84
-
85
-
86
-
87
-
88
-
89
-
90
-
91
-
92
-
93
-
94
-
95
-
96
-
97
-
98
-
99
-
100
-
101
-
102
-
103
-
104
-
105
-
106
-
107
-
108
-
109
-
110
-
111
-
112
-
113
-
114
-
115
-
116
-
117
-
118
-
119
-
120
-
121
-
122
-
123
-
124
-
125
-
126
-
127
-
128
-
129
-
130
-
131
-
132
-
133
-
134
-
135
-
136
-
137
-
138
-
139
-
140
-
141
-
142
-
143
-
 144
144 -
 145
145 -
 146
146 -
 147
147 -
 148
148 -
 149
149 -
 150
150 -
 151
151 -
 152
152 -
 153
153 -
 154
154 -
 155
155 -
 156
156 -
 157
157 -
 158
158 -
 159
159 -
 160
160 -
 161
161 -
 162
162 -
 163
163 -
 164
164 -
165
-
166
-
167
-
168
-
169
-
170
-
171
-
172
-
173
-
174
-
175
-
176
-
177
-
178
-
179
-
180
-
181
-
182
-
183
-
184
-
185
-
186
-
187
-
188
-
189
-
190
-
191
-
192
-
193
-
194
-
195
-
196
-
197
-
198
-
199
-
200
-
201
-
202
-
203
-
204
-
205
-
206
-
207
-
208
-
209
-
210
-
211
-
212
-
213
-
214
-
215
-
216
-
217
-
218
-
219
-
220
-
221
-
222
-
223
-
224
-
225
-
226
-
227
-
228
-
229
-
230
-
231
-
232
-
233
-
234
-
235
-
236
-
237
-
238
-
239
-
240
-
241
-
242
-
243
-
244
-
245
-
246
-
247
-
248
-
249
-
250
-
251
-
252
-
253
-
254
-
255
-
256
-
257
-
258
-
259
-
260
-
261
-
262
-
263
-
264
-
265
-
266
-
267
-
268
-
269
-
270
-
271
-
272
-
273
-
274
-
275
-
276
-
277
-
278
-
279
-
280
-
281
-
282
-
283
-
284
-
285
-
286
-
287
-
288
-
289
-
290
-
291
-
292
-
293
-
294
-
295
-
296
-
297
-
298
-
299
-
300
-
301
-
302
-
303
-
304
-
305
-
306
-
307
-
308
-
309
-
310
-
311
-
312
-
313
-
314
-
315
-
316
-
317
-
318
-
319
-
320
-
321
-
322
-
323
-
324
-
325
-
326
-
327
-
328
-
329
-
330
-
331
-
332
-
333
-
334
-
335
-
336
-
337
-
338
-
339
-
340
-
341
-
342
-
343
-
344
-
345
-
346
-
347
-
348
-
349
-
350
-
351
-
352
-
353
-
354
-
355
-
356
-
357
-
358
-
359
-
360
-
361
-
362
-
363
-
364
-
365
-
366
-
367
-
368
-
369
-
370
-
371
-
372
-
373
-
374
-
375
-
376
-
377
-
378
-
379
-
380
-
381
-
382
-
383
-
384
-
385
-
386
-
387
-
388
-
389
-
390
 |
 |

RBS Group Annual Report and Accounts 2009152
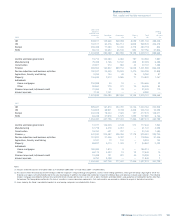
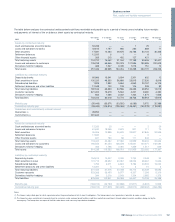
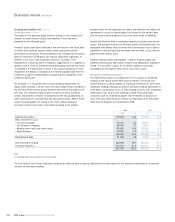
Balance sheet analysis continued
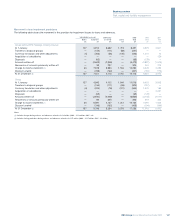
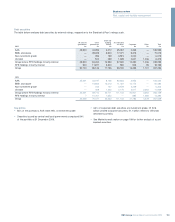
Past due analysis
The following loans and advances to customers were past due at the balance sheet date but not considered impaired:
2009
Group before RFS RFS Holdings
Holdings minority minority 2008 2007
Core Non-Core interest interest Group Group Group
£m £m £m £m £m £m £m
Past due 1-29 days 5,101 1,486 6,587 1,209 7,796 9,517 8,768
Past due 30-59 days 1,943 357 2,300 424 2,724 2,941 2,745
Past due 60-89 days 2,203 207 2,410 177 2,587 1,427 1,354
Past due 90 days or more 1,358 1,820 3,178 46 3,224 1,782 369
10,605 3,870 14,475 1,856 16,331 15,667 13,236
Note:
(1) These balances include loans and advances to customers that are past due through administrative and other delays in recording payments or in finalising documentation and other events
unrelated to credit quality.
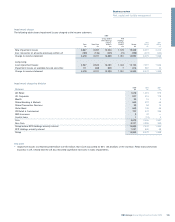
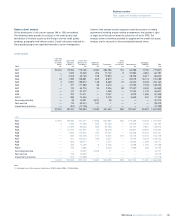
Industry risk – geographical analysis
The table below analyses financial assets by location of office and by industry type.
Loans and
advances to Netting
banks and and
customers Securities Derivatives Other (1) Total offset(2)
2009 £m £m £m £m £m £m
UK 446,590 142,919 280,943 6,537 876,989 252,352
US 102,106 55,796 128,756 5,920 292,578 113,670
Europe 248,204 71,016 5,228 149 324,597 —
RoW 40,529 18,529 26,527 848 86,433 19,803
837,429 288,260 441,454 13,454 1,580,597 385,825
Central and local government 9,006 155,118 7,013 205 171,342 1,725
Manufacturing 48,683 2,260 5,420 116 56,479 3,184
Construction 15,214 615 928 63 16,820 1,452
Finance (3) 201,779 107,116 411,017 12,118 732,030 372,343
Service industries and business activities 154,657 15,403 12,025 795 182,880 5,824
Agriculture, forestry and fishing 8,665 282 65 9 9,021 76
Property 103,013 4,509 4,517 108 112,147 1,114
Individuals:
Home mortgages 230,412 729 241 — 231,382 7
Other 43,341 1 212 40 43,594 61
Finance lease and instalment credit 20,103 306 16 — 20,425 39
Interest accruals 2,556 1,921 — — 4,477 —
837,429 288,260 441,454 13,454 1,580,597 385,825
For notes refer to the following page.
Business review continued