RBS 2009 Annual Report Download - page 208
Download and view the complete annual report
Please find page 208 of the 2009 RBS annual report below. You can navigate through the pages in the report by either clicking on the pages listed below, or by using the keyword search tool below to find specific information within the annual report.-
 1
1 -
2
-
3
-
4
-
5
-
6
-
7
-
8
-
9
-
10
-
11
-
12
-
13
-
14
-
15
-
16
-
17
-
18
-
19
-
20
-
21
-
22
-
23
-
24
-
25
-
26
-
27
-
28
-
29
-
30
-
31
-
32
-
33
-
34
-
35
-
36
-
37
-
38
-
39
-
40
-
41
-
42
-
43
-
44
-
45
-
46
-
47
-
48
-
49
-
50
-
51
-
52
-
53
-
54
-
55
-
56
-
57
-
58
-
59
-
60
-
61
-
62
-
63
-
64
-
65
-
66
-
67
-
68
-
69
-
70
-
71
-
72
-
73
-
74
-
75
-
76
-
77
-
78
-
79
-
80
-
81
-
82
-
83
-
84
-
85
-
86
-
87
-
88
-
89
-
90
-
91
-
92
-
93
-
94
-
95
-
96
-
97
-
98
-
99
-
100
-
101
-
102
-
103
-
104
-
105
-
106
-
107
-
108
-
109
-
110
-
111
-
112
-
113
-
114
-
115
-
116
-
117
-
118
-
119
-
120
-
121
-
122
-
123
-
124
-
125
-
126
-
127
-
128
-
129
-
130
-
131
-
132
-
133
-
134
-
135
-
136
-
137
-
138
-
139
-
140
-
141
-
142
-
143
-
144
-
145
-
146
-
147
-
148
-
149
-
150
-
151
-
152
-
153
-
154
-
155
-
156
-
157
-
158
-
159
-
160
-
161
-
162
-
163
-
164
-
165
-
166
-
167
-
168
-
169
-
170
-
171
-
172
-
173
-
174
-
175
-
176
-
177
-
178
-
179
-
180
-
181
-
182
-
183
-
184
-
185
-
186
-
187
-
188
-
189
-
190
-
191
-
192
-
193
-
194
-
195
-
196
-
197
-
 198
198 -
 199
199 -
 200
200 -
 201
201 -
 202
202 -
 203
203 -
 204
204 -
 205
205 -
 206
206 -
 207
207 -
 208
208 -
 209
209 -
 210
210 -
 211
211 -
 212
212 -
 213
213 -
 214
214 -
 215
215 -
 216
216 -
 217
217 -
 218
218 -
219
-
220
-
221
-
222
-
223
-
224
-
225
-
226
-
227
-
228
-
229
-
230
-
231
-
232
-
233
-
234
-
235
-
236
-
237
-
238
-
239
-
240
-
241
-
242
-
243
-
244
-
245
-
246
-
247
-
248
-
249
-
250
-
251
-
252
-
253
-
254
-
255
-
256
-
257
-
258
-
259
-
260
-
261
-
262
-
263
-
264
-
265
-
266
-
267
-
268
-
269
-
270
-
271
-
272
-
273
-
274
-
275
-
276
-
277
-
278
-
279
-
280
-
281
-
282
-
283
-
284
-
285
-
286
-
287
-
288
-
289
-
290
-
291
-
292
-
293
-
294
-
295
-
296
-
297
-
298
-
299
-
300
-
301
-
302
-
303
-
304
-
305
-
306
-
307
-
308
-
309
-
310
-
311
-
312
-
313
-
314
-
315
-
316
-
317
-
318
-
319
-
320
-
321
-
322
-
323
-
324
-
325
-
326
-
327
-
328
-
329
-
330
-
331
-
332
-
333
-
334
-
335
-
336
-
337
-
338
-
339
-
340
-
341
-
342
-
343
-
344
-
345
-
346
-
347
-
348
-
349
-
350
-
351
-
352
-
353
-
354
-
355
-
356
-
357
-
358
-
359
-
360
-
361
-
362
-
363
-
364
-
365
-
366
-
367
-
368
-
369
-
370
-
371
-
372
-
373
-
374
-
375
-
376
-
377
-
378
-
379
-
380
-
381
-
382
-
383
-
384
-
385
-
386
-
387
-
388
-
389
-
390
 |
 |

Business review continued
RBS Group Annual Report and Accounts 2009206
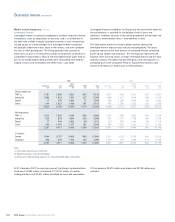
Market turmoil exposures continued
Special purpose entities continued
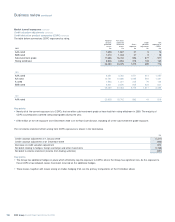
Third party sponsored conduits
The Group also extends liquidity commitments to multi-seller conduits sponsored by other banks, but typically does not consolidate these entities as
the Group does not retain the majority of risks and rewards.
The Group’s exposure from third-party conduits is analysed below.
2009
Core Non-Core Total 2008 2007
£m £m £m £m £m
Liquidity and credit enhancements:
Deal specific liquidity:
drawn 223 120 343 3,078 2,280
undrawn 206 38 244 198 490
Programme-wide liquidity:
drawn ———102 250
undrawn ———504 899
429 158 587 3,882 3,919
Maximum exposure to loss (1) 429 158 587 3,882 3,919
Note:
(1) Maximum exposure to loss is determined as the Group’s total liquidity commitments to the conduits and additionally programme-wide credit support which would absorb first loss on transactions
where liquidity support is provided by a third party.
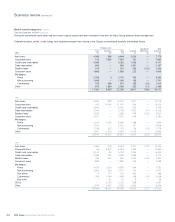
Structured investment vehicles*
The Group does not sponsor any structured investment vehicles.
Investment funds set up and managed by the Group*
The Group has established and manages a number of money market
funds for its customers. When a new money market fund is launched,
the Group typically provides a limited amount of seed capital to the
funds. The Group has investments in these funds of £776 million at
31 December 2009 (2008 – £107 million). The investors in both money
market and non-money market funds have recourse to the assets of the
funds only. These funds are not consolidated by the Group.
At 31 December 2009 the Group had exposure to one fund
amounting to £145 million (2008 – £144 million).
Money market funds
The Group’s money market funds held assets of £9.6 billion at
31 December 2009 (2008 – £13.6 billion). The sub-categories of
money market funds are:
•£8.0 billion (2008 – £8.0 billion) in money market funds managed by
the Group denominated in sterling, US dollars and euro. The funds
invest in short-dated, highly rated money market securities with the
objective of ensuring stability of capital and net asset value per
share, appropriate levels of liquid assets, together with an income
which is comparable to the short dated money market interest rate in
the relevant currency.
•£0.4 billion (2008 – £0.7 billion) in money market ‘Plus’ funds
managed by the Group denominated in sterling, US dollars and euro.
The funds invest in longer-dated, highly rated securities with the
objective of providing enhanced returns over the average return on
comparable cash deposits.
•£1.2 billion (2008 – £4.9 billion) in third party multi-manager money
market funds denominated in sterling, US dollars and euro. The
funds invest in short dated, highly rated securities with the objective
of maximising current income consistent with the preservation of
capital and liquidity.
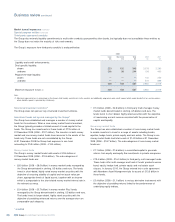
Non-money market funds
The Group has also established a number of non-money market funds
to enable investors to invest in a range of assets including bonds,
equities, hedge funds, private equity and real estate. The Group’s non-
money market funds had total assets of £14.9 billion at 31 December
2009 (2008 – £18.7 billion). The sub-categories of non-money market
funds are:
•£1.1 billion (2008 – £1.6 billion) in committed capital to generate
returns from equity and equity-like investments in private companies.
•£13.4 billion (2008 – £16.0 billion) in third party, multi-manager funds.
These funds offer multi-manager and fund of funds’ products across
bond, equity, hedge fund, private equity and real estate asset
classes. In January 2010, the Group entered into a sale agreement
with Aberdeen Asset Management plc for assets of £13.3 billion in
these funds.
•£0.4 billion (2008 – £1.1 billion) in various derivative instruments with
the objective of providing returns linked to the performance of
underlying equity indices.
* unaudited