RBS 2009 Annual Report Download - page 300
Download and view the complete annual report
Please find page 300 of the 2009 RBS annual report below. You can navigate through the pages in the report by either clicking on the pages listed below, or by using the keyword search tool below to find specific information within the annual report.-
 1
1 -
2
-
3
-
4
-
5
-
6
-
7
-
8
-
9
-
10
-
11
-
12
-
13
-
14
-
15
-
16
-
17
-
18
-
19
-
20
-
21
-
22
-
23
-
24
-
25
-
26
-
27
-
28
-
29
-
30
-
31
-
32
-
33
-
34
-
35
-
36
-
37
-
38
-
39
-
40
-
41
-
42
-
43
-
44
-
45
-
46
-
47
-
48
-
49
-
50
-
51
-
52
-
53
-
54
-
55
-
56
-
57
-
58
-
59
-
60
-
61
-
62
-
63
-
64
-
65
-
66
-
67
-
68
-
69
-
70
-
71
-
72
-
73
-
74
-
75
-
76
-
77
-
78
-
79
-
80
-
81
-
82
-
83
-
84
-
85
-
86
-
87
-
88
-
89
-
90
-
91
-
92
-
93
-
94
-
95
-
96
-
97
-
98
-
99
-
100
-
101
-
102
-
103
-
104
-
105
-
106
-
107
-
108
-
109
-
110
-
111
-
112
-
113
-
114
-
115
-
116
-
117
-
118
-
119
-
120
-
121
-
122
-
123
-
124
-
125
-
126
-
127
-
128
-
129
-
130
-
131
-
132
-
133
-
134
-
135
-
136
-
137
-
138
-
139
-
140
-
141
-
142
-
143
-
144
-
145
-
146
-
147
-
148
-
149
-
150
-
151
-
152
-
153
-
154
-
155
-
156
-
157
-
158
-
159
-
160
-
161
-
162
-
163
-
164
-
165
-
166
-
167
-
168
-
169
-
170
-
171
-
172
-
173
-
174
-
175
-
176
-
177
-
178
-
179
-
180
-
181
-
182
-
183
-
184
-
185
-
186
-
187
-
188
-
189
-
190
-
191
-
192
-
193
-
194
-
195
-
196
-
197
-
198
-
199
-
200
-
201
-
202
-
203
-
204
-
205
-
206
-
207
-
208
-
209
-
210
-
211
-
212
-
213
-
214
-
215
-
216
-
217
-
218
-
219
-
220
-
221
-
222
-
223
-
224
-
225
-
226
-
227
-
228
-
229
-
230
-
231
-
232
-
233
-
234
-
235
-
236
-
237
-
238
-
239
-
240
-
241
-
242
-
243
-
244
-
245
-
246
-
247
-
248
-
249
-
250
-
251
-
252
-
253
-
254
-
255
-
256
-
257
-
258
-
259
-
260
-
261
-
262
-
263
-
264
-
265
-
266
-
267
-
268
-
269
-
270
-
271
-
272
-
273
-
274
-
275
-
276
-
277
-
278
-
279
-
280
-
281
-
282
-
283
-
284
-
285
-
286
-
287
-
288
-
289
-
 290
290 -
 291
291 -
 292
292 -
 293
293 -
 294
294 -
 295
295 -
 296
296 -
 297
297 -
 298
298 -
 299
299 -
 300
300 -
 301
301 -
 302
302 -
 303
303 -
 304
304 -
 305
305 -
 306
306 -
 307
307 -
 308
308 -
 309
309 -
 310
310 -
311
-
312
-
313
-
314
-
315
-
316
-
317
-
318
-
319
-
320
-
321
-
322
-
323
-
324
-
325
-
326
-
327
-
328
-
329
-
330
-
331
-
332
-
333
-
334
-
335
-
336
-
337
-
338
-
339
-
340
-
341
-
342
-
343
-
344
-
345
-
346
-
347
-
348
-
349
-
350
-
351
-
352
-
353
-
354
-
355
-
356
-
357
-
358
-
359
-
360
-
361
-
362
-
363
-
364
-
365
-
366
-
367
-
368
-
369
-
370
-
371
-
372
-
373
-
374
-
375
-
376
-
377
-
378
-
379
-
380
-
381
-
382
-
383
-
384
-
385
-
386
-
387
-
388
-
389
-
390
 |
 |

Notes on the accounts continued
RBS Group Annual Report and Accounts 2009298
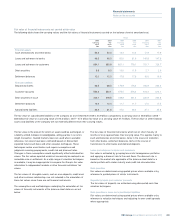
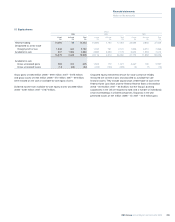
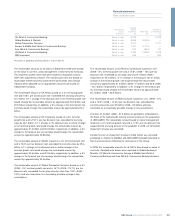
14 Debt securities continued
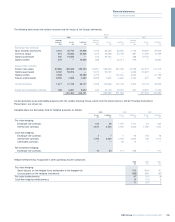
The following table analyses by issuer the Group’s available-for-sale debt securities by remaining maturity and the related yield (based on weighted
averages).
After 1 but After 5 but
Within 1 year within 5 years within 10 years After 10 years Total
Amount Yield Amount Yield Amount Yield Amount Yield Amount Yield
2009 £m % £m % £m % £m % £m %
UK central and local government 11,815 — 2,618 4.0 2,439 4.8 2,199 4.3 19,071 1.7
US central and local government 294 2.4 5,620 1.4 6,957 3.7 101 7.0 12,972 2.6
Other central and local government 11,446 2.6 17,736 3.3 10,496 4.0 5,834 5.0 45,512 3.5
Bank and building society 4,617 2.2 4,972 3.0 972 3.7 649 2.1 11,210 2.7
Mortgage-backed securities (1) 1,377 3.2 12,016 2.5 13,055 2.2 24,596 2.5 51,044 2.5
Corporate 469 4.4 1,586 3.1 633 3.6 677 2.8 3,365 3.3
Other (2) 83.31164.0————1243.9
Total fair value 30,026 1.5 44,664 2.9 34,552 3.2 34,056 3.1 143,298 2.7
Notes:
(1) Includes securities issued by US federal agencies and government sponsored entities.
(2) Includes securities, other than asset-backed securities, issued by US federal agencies and government sponsored entities.
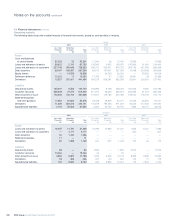
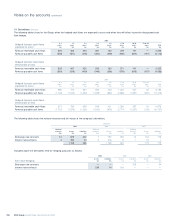
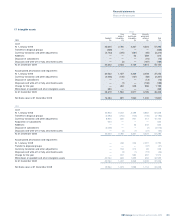
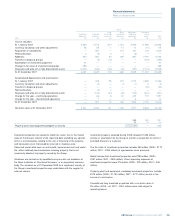
The table below shows the fair value of available-for-sale debt securities that were in an unrealised loss position at 31 December 2009.
Less than12 months More than12 months Total
Gross Gross Gross
unrealised unrealised unrealised
Fair value losses Fair value losses Fair value losses
2009 £m £m £m £m £m £m
UK central and local government 2,824 60 26 — 2,850 60
US central and local government 5,526 88 7 1 5,533 89
Other central and local government 6,935 260 391 6 7,326 266
Bank and building society 8,965 60 869 59 9,834 119
Mortgage-backed securities 3,185 983 23,950 2,331 27,135 3,314
Corporate 384 14 167 42 551 56
Other 710 3 16 3 726 6
28,529 1,468 25,426 2,442 53,955 3,910
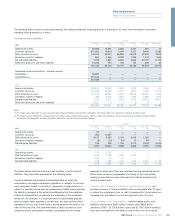
Gross gains of £1,288 million (2008 – £1,633 million; 2007 – £60 million) and gross losses of £1,255 million (2008 – £1,411 million; 2007 – £12 million)
were realised on the sale of available-for-sale securities.
Impairment losses on available-for-sale debt securities are recognised
when there is objective evidence of impairment. The Group reviews its
portfolios of available-for-sale financial assets for such evidence which
includes: default or delinquency in interest or principal payments;
significant financial difficulty of the issuer or obligor; and it becoming
probable that the issuer will enter bankruptcy or other financial
reorganisation. However, the disappearance of an active market
because an entity’s financial instruments are no longer publicly traded is
not evidence of impairment. Furthermore, a downgrade of an entity’s
credit rating is not, of itself, evidence of impairment, although it may be
evidence of impairment when considered with other available
information. A decline in the fair value of a financial asset below its cost
or amortised cost is not necessarily evidence of impairment. The
existence of stand alone credit protection of an available-for-sale debt
security has no effect on the Group’s assessment of whether or not the
security is impaired. If an available-for-sale debt security benefits from
credit protection that is integral to the security, the creditworthiness of
the provider of that protection is taken into account when determining
whether there is objective evidence that the security is impaired.
Determining whether objective evidence of impairment exists requires
the exercise of management judgment. The unrealised losses on the
Group’s available-for-sale debt securities are concentrated in its
portfolios of mortgage-backed securities. The losses reflect the
widening of credit spreads as a result of the reduced market liquidity in
these securities and the current uncertain macro-economic outlook in
US and Europe. The underlying securities remain unimpaired.