RBS 2009 Annual Report Download - page 355
Download and view the complete annual report
Please find page 355 of the 2009 RBS annual report below. You can navigate through the pages in the report by either clicking on the pages listed below, or by using the keyword search tool below to find specific information within the annual report.-
 1
1 -
2
-
3
-
4
-
5
-
6
-
7
-
8
-
9
-
10
-
11
-
12
-
13
-
14
-
15
-
16
-
17
-
18
-
19
-
20
-
21
-
22
-
23
-
24
-
25
-
26
-
27
-
28
-
29
-
30
-
31
-
32
-
33
-
34
-
35
-
36
-
37
-
38
-
39
-
40
-
41
-
42
-
43
-
44
-
45
-
46
-
47
-
48
-
49
-
50
-
51
-
52
-
53
-
54
-
55
-
56
-
57
-
58
-
59
-
60
-
61
-
62
-
63
-
64
-
65
-
66
-
67
-
68
-
69
-
70
-
71
-
72
-
73
-
74
-
75
-
76
-
77
-
78
-
79
-
80
-
81
-
82
-
83
-
84
-
85
-
86
-
87
-
88
-
89
-
90
-
91
-
92
-
93
-
94
-
95
-
96
-
97
-
98
-
99
-
100
-
101
-
102
-
103
-
104
-
105
-
106
-
107
-
108
-
109
-
110
-
111
-
112
-
113
-
114
-
115
-
116
-
117
-
118
-
119
-
120
-
121
-
122
-
123
-
124
-
125
-
126
-
127
-
128
-
129
-
130
-
131
-
132
-
133
-
134
-
135
-
136
-
137
-
138
-
139
-
140
-
141
-
142
-
143
-
144
-
145
-
146
-
147
-
148
-
149
-
150
-
151
-
152
-
153
-
154
-
155
-
156
-
157
-
158
-
159
-
160
-
161
-
162
-
163
-
164
-
165
-
166
-
167
-
168
-
169
-
170
-
171
-
172
-
173
-
174
-
175
-
176
-
177
-
178
-
179
-
180
-
181
-
182
-
183
-
184
-
185
-
186
-
187
-
188
-
189
-
190
-
191
-
192
-
193
-
194
-
195
-
196
-
197
-
198
-
199
-
200
-
201
-
202
-
203
-
204
-
205
-
206
-
207
-
208
-
209
-
210
-
211
-
212
-
213
-
214
-
215
-
216
-
217
-
218
-
219
-
220
-
221
-
222
-
223
-
224
-
225
-
226
-
227
-
228
-
229
-
230
-
231
-
232
-
233
-
234
-
235
-
236
-
237
-
238
-
239
-
240
-
241
-
242
-
243
-
244
-
245
-
246
-
247
-
248
-
249
-
250
-
251
-
252
-
253
-
254
-
255
-
256
-
257
-
258
-
259
-
260
-
261
-
262
-
263
-
264
-
265
-
266
-
267
-
268
-
269
-
270
-
271
-
272
-
273
-
274
-
275
-
276
-
277
-
278
-
279
-
280
-
281
-
282
-
283
-
284
-
285
-
286
-
287
-
288
-
289
-
290
-
291
-
292
-
293
-
294
-
295
-
296
-
297
-
298
-
299
-
300
-
301
-
302
-
303
-
304
-
305
-
306
-
307
-
308
-
309
-
310
-
311
-
312
-
313
-
314
-
315
-
316
-
317
-
318
-
319
-
320
-
321
-
322
-
323
-
324
-
325
-
326
-
327
-
328
-
329
-
330
-
331
-
332
-
333
-
334
-
335
-
336
-
337
-
338
-
339
-
340
-
341
-
342
-
343
-
344
-
 345
345 -
 346
346 -
 347
347 -
 348
348 -
 349
349 -
 350
350 -
 351
351 -
 352
352 -
 353
353 -
 354
354 -
 355
355 -
 356
356 -
 357
357 -
 358
358 -
 359
359 -
 360
360 -
 361
361 -
 362
362 -
 363
363 -
 364
364 -
 365
365 -
366
-
367
-
368
-
369
-
370
-
371
-
372
-
373
-
374
-
375
-
376
-
377
-
378
-
379
-
380
-
381
-
382
-
383
-
384
-
385
-
386
-
387
-
388
-
389
-
390
 |
 |

Additional information
353RBS Group Annual Report and Accounts 2009
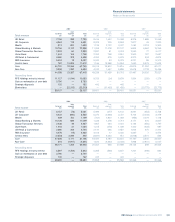
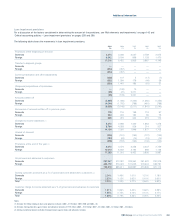
Loan impairment provisions
For a discussion of the factors considered in determining the amount of the provisions, see ‘Risk elements and impairments’ on page 142 and
‘Critical accounting policies – Loan impairment provisions’ on pages 255 and 256.
The following table shows the movements in loan impairment provisions.
2009 2008 2007 2006 2005
£m £m £m £m £m
Provisions at the beginning of the year
Domestic 4,474 3,258 3,037 2,759 2,675
Foreign 6,542 3,194 898 1,128 1,470
11,016 6,452 3,935 3,887 4,145
Transfer to disposal groups
Domestic —————
Foreign (324) (767) — — —
(324) (767) — — —
Currency translation and other adjustments
Domestic (228) 107 5 (17) (7)
Foreign (302) 1,334 178 (44) 58
(530) 1,441 183 (61) 51
(Disposals)/acquisitions of businesses
Domestic —(108) 10 — —
Foreign (65) (70) 2,211 — —
(65) (178) 2,221 — —
Amounts written-off
Domestic (2,895) (1,446) (1,222) (1,360) (1,252)
Foreign (4,044) (1,702) (789) (481) (788)
(6,939) (3,148) (2,011) (1,841) (2,040)
Recoveries of amounts written-off in previous years
Domestic 175 116 158 119 97
Foreign 224 203 184 96 75
399 319 342 215 172
Charged to income statement (1)
Domestic 5,370 2,698 1,420 1,663 1,376
Foreign 8,764 4,393 526 214 327
14,134 7,091 1,946 1,877 1,703
Unwind of discount
Domestic (226) (151) (150) (127) (130)
Foreign (182) (43) (14) (15) (14)
(408) (194) (164) (142) (144)
Provisions at the end of the year (2)
Domestic 6,670 4,474 3,258 3,037 2,759
Foreign 10,613 6,542 3,194 898 1,128
17,283 11,016 6,452 3,935 3,887
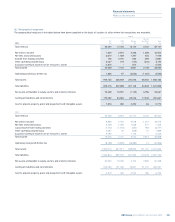
Gross loans and advances to customers
Domestic 297,347 312,287 323,362 251,522 232,319
Foreign 448,172 573,324 511,625 219,304 188,791
745,519 885,611 834,987 470,826 421,110
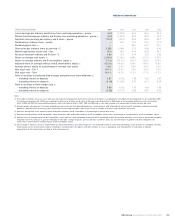
Closing customer provisions as a % of gross loans and advances to customers (3)
Domestic 2.24% 1.43% 1.01% 1.21% 1.19%
Foreign 2.33% 1.12% 0.62% 0.41% 0.60%
Total 2.30% 1.23% 0.77% 0.84% 0.92%
Customer charge to income statement as a % of gross loans and advances to customers
Domestic 1.81% 0.86% 0.44% 0.66% 0.59%
Foreign 1.95% 0.75% 0.10% 0.10% 0.17%
Total 1.89% 0.79% 0.23% 0.40% 0.40%
Notes:
(1) Includes £34 million relating to loans and advances to banks (2008 – £118 million; 2007, 2006 and 2005 – nil).
(2) Includes closing provisions against loans and advances to banks of £157 million (2008 – £127 million; 2007 – £3 million; 2006 – £2 million; 2005 – £3 million).
(3) Closing customer provisions exclude closing provisions against loans and advances to banks.