RBS 2009 Annual Report Download - page 92
Download and view the complete annual report
Please find page 92 of the 2009 RBS annual report below. You can navigate through the pages in the report by either clicking on the pages listed below, or by using the keyword search tool below to find specific information within the annual report.-
 1
1 -
2
-
3
-
4
-
5
-
6
-
7
-
8
-
9
-
10
-
11
-
12
-
13
-
14
-
15
-
16
-
17
-
18
-
19
-
20
-
21
-
22
-
23
-
24
-
25
-
26
-
27
-
28
-
29
-
30
-
31
-
32
-
33
-
34
-
35
-
36
-
37
-
38
-
39
-
40
-
41
-
42
-
43
-
44
-
45
-
46
-
47
-
48
-
49
-
50
-
51
-
52
-
53
-
54
-
55
-
56
-
57
-
58
-
59
-
60
-
61
-
62
-
63
-
64
-
65
-
66
-
67
-
68
-
69
-
70
-
71
-
72
-
73
-
74
-
75
-
76
-
77
-
78
-
79
-
80
-
81
-
 82
82 -
 83
83 -
 84
84 -
 85
85 -
 86
86 -
 87
87 -
 88
88 -
 89
89 -
 90
90 -
 91
91 -
 92
92 -
 93
93 -
 94
94 -
 95
95 -
 96
96 -
 97
97 -
 98
98 -
 99
99 -
 100
100 -
 101
101 -
 102
102 -
103
-
104
-
105
-
106
-
107
-
108
-
109
-
110
-
111
-
112
-
113
-
114
-
115
-
116
-
117
-
118
-
119
-
120
-
121
-
122
-
123
-
124
-
125
-
126
-
127
-
128
-
129
-
130
-
131
-
132
-
133
-
134
-
135
-
136
-
137
-
138
-
139
-
140
-
141
-
142
-
143
-
144
-
145
-
146
-
147
-
148
-
149
-
150
-
151
-
152
-
153
-
154
-
155
-
156
-
157
-
158
-
159
-
160
-
161
-
162
-
163
-
164
-
165
-
166
-
167
-
168
-
169
-
170
-
171
-
172
-
173
-
174
-
175
-
176
-
177
-
178
-
179
-
180
-
181
-
182
-
183
-
184
-
185
-
186
-
187
-
188
-
189
-
190
-
191
-
192
-
193
-
194
-
195
-
196
-
197
-
198
-
199
-
200
-
201
-
202
-
203
-
204
-
205
-
206
-
207
-
208
-
209
-
210
-
211
-
212
-
213
-
214
-
215
-
216
-
217
-
218
-
219
-
220
-
221
-
222
-
223
-
224
-
225
-
226
-
227
-
228
-
229
-
230
-
231
-
232
-
233
-
234
-
235
-
236
-
237
-
238
-
239
-
240
-
241
-
242
-
243
-
244
-
245
-
246
-
247
-
248
-
249
-
250
-
251
-
252
-
253
-
254
-
255
-
256
-
257
-
258
-
259
-
260
-
261
-
262
-
263
-
264
-
265
-
266
-
267
-
268
-
269
-
270
-
271
-
272
-
273
-
274
-
275
-
276
-
277
-
278
-
279
-
280
-
281
-
282
-
283
-
284
-
285
-
286
-
287
-
288
-
289
-
290
-
291
-
292
-
293
-
294
-
295
-
296
-
297
-
298
-
299
-
300
-
301
-
302
-
303
-
304
-
305
-
306
-
307
-
308
-
309
-
310
-
311
-
312
-
313
-
314
-
315
-
316
-
317
-
318
-
319
-
320
-
321
-
322
-
323
-
324
-
325
-
326
-
327
-
328
-
329
-
330
-
331
-
332
-
333
-
334
-
335
-
336
-
337
-
338
-
339
-
340
-
341
-
342
-
343
-
344
-
345
-
346
-
347
-
348
-
349
-
350
-
351
-
352
-
353
-
354
-
355
-
356
-
357
-
358
-
359
-
360
-
361
-
362
-
363
-
364
-
365
-
366
-
367
-
368
-
369
-
370
-
371
-
372
-
373
-
374
-
375
-
376
-
377
-
378
-
379
-
380
-
381
-
382
-
383
-
384
-
385
-
386
-
387
-
388
-
389
-
390
 |
 |

RBS Group Annual Report and Accounts 200990
Business review continued
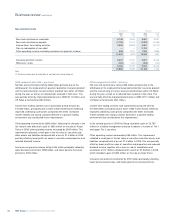
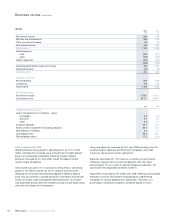
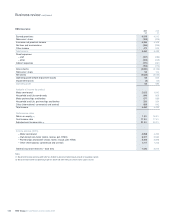
UK Corporate
2009 2008
£m £m
Net interest income 2,292 2,448
Net fees and commissions 858 829
Other non-interest income 432 460
Non–interest income 1,290 1,289
Total income 3,582 3,737
Direct expenses
– staff (753) (801)
– other (268) (318)
Indirect expenses (509) (518)
(1,530) (1,637)
Operating profit before impairment losses 2,052 2,100
Impairment losses (927) (319)
Operating profit 1,125 1,781
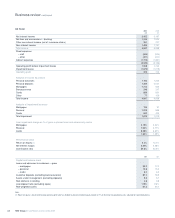
Analysis of income by business
Corporate and commercial lending 2,401 2,166
Asset and invoice finance 232 241
Corporate deposits 985 1,266
Other (36) 64
Total income 3,582 3,737
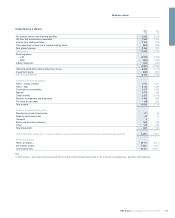
Analysis of impairment by sector
Banks and financial institutions 15 9
Hotels and restaurants 98 25
Housebuilding and construction 106 42
Manufacturing 51 14
Other 150 53
Private sector education, health, social work, recreational and community services 59 15
Property 259 24
Wholesale and retail trade, repairs 76 37
Asset and invoice finance 113 100
Total impairment 927 319
Loan impairment charge as % of gross customer loans and advances (excluding reverse repurchase agreements) by sector
Banks and financial Institutions 0.29% 0.17%
Hotels and restaurants 1.75% 0.41%
Housebuilding and construction 3.12% 0.81%
Manufacturing 1.38% 0.26%
Other 0.36% 0.14%
Private sector education, health, social work, recreational and community services 0.80% 0.20%
Property 0.93% 0.08%
Wholesale and retail trade, repairs 0.97% 0.41%
Asset and invoice finance 1.33% 1.18%
0.83% 0.27%
Performance ratios
Return on equity (1) 10.3% 18.0%
Net interest margin 2.22% 2.40%
Cost:income ratio 42.7% 43.8%