RBS 2009 Annual Report Download - page 20
Download and view the complete annual report
Please find page 20 of the 2009 RBS annual report below. You can navigate through the pages in the report by either clicking on the pages listed below, or by using the keyword search tool below to find specific information within the annual report.-
 1
1 -
2
-
3
-
4
-
5
-
6
-
7
-
8
-
9
-
 10
10 -
 11
11 -
 12
12 -
 13
13 -
 14
14 -
 15
15 -
 16
16 -
 17
17 -
 18
18 -
 19
19 -
 20
20 -
 21
21 -
 22
22 -
 23
23 -
 24
24 -
 25
25 -
 26
26 -
 27
27 -
 28
28 -
 29
29 -
 30
30 -
31
-
32
-
33
-
34
-
35
-
36
-
37
-
38
-
39
-
40
-
41
-
42
-
43
-
44
-
45
-
46
-
47
-
48
-
49
-
50
-
51
-
52
-
53
-
54
-
55
-
56
-
57
-
58
-
59
-
60
-
61
-
62
-
63
-
64
-
65
-
66
-
67
-
68
-
69
-
70
-
71
-
72
-
73
-
74
-
75
-
76
-
77
-
78
-
79
-
80
-
81
-
82
-
83
-
84
-
85
-
86
-
87
-
88
-
89
-
90
-
91
-
92
-
93
-
94
-
95
-
96
-
97
-
98
-
99
-
100
-
101
-
102
-
103
-
104
-
105
-
106
-
107
-
108
-
109
-
110
-
111
-
112
-
113
-
114
-
115
-
116
-
117
-
118
-
119
-
120
-
121
-
122
-
123
-
124
-
125
-
126
-
127
-
128
-
129
-
130
-
131
-
132
-
133
-
134
-
135
-
136
-
137
-
138
-
139
-
140
-
141
-
142
-
143
-
144
-
145
-
146
-
147
-
148
-
149
-
150
-
151
-
152
-
153
-
154
-
155
-
156
-
157
-
158
-
159
-
160
-
161
-
162
-
163
-
164
-
165
-
166
-
167
-
168
-
169
-
170
-
171
-
172
-
173
-
174
-
175
-
176
-
177
-
178
-
179
-
180
-
181
-
182
-
183
-
184
-
185
-
186
-
187
-
188
-
189
-
190
-
191
-
192
-
193
-
194
-
195
-
196
-
197
-
198
-
199
-
200
-
201
-
202
-
203
-
204
-
205
-
206
-
207
-
208
-
209
-
210
-
211
-
212
-
213
-
214
-
215
-
216
-
217
-
218
-
219
-
220
-
221
-
222
-
223
-
224
-
225
-
226
-
227
-
228
-
229
-
230
-
231
-
232
-
233
-
234
-
235
-
236
-
237
-
238
-
239
-
240
-
241
-
242
-
243
-
244
-
245
-
246
-
247
-
248
-
249
-
250
-
251
-
252
-
253
-
254
-
255
-
256
-
257
-
258
-
259
-
260
-
261
-
262
-
263
-
264
-
265
-
266
-
267
-
268
-
269
-
270
-
271
-
272
-
273
-
274
-
275
-
276
-
277
-
278
-
279
-
280
-
281
-
282
-
283
-
284
-
285
-
286
-
287
-
288
-
289
-
290
-
291
-
292
-
293
-
294
-
295
-
296
-
297
-
298
-
299
-
300
-
301
-
302
-
303
-
304
-
305
-
306
-
307
-
308
-
309
-
310
-
311
-
312
-
313
-
314
-
315
-
316
-
317
-
318
-
319
-
320
-
321
-
322
-
323
-
324
-
325
-
326
-
327
-
328
-
329
-
330
-
331
-
332
-
333
-
334
-
335
-
336
-
337
-
338
-
339
-
340
-
341
-
342
-
343
-
344
-
345
-
346
-
347
-
348
-
349
-
350
-
351
-
352
-
353
-
354
-
355
-
356
-
357
-
358
-
359
-
360
-
361
-
362
-
363
-
364
-
365
-
366
-
367
-
368
-
369
-
370
-
371
-
372
-
373
-
374
-
375
-
376
-
377
-
378
-
379
-
380
-
381
-
382
-
383
-
384
-
385
-
386
-
387
-
388
-
389
-
390
 |
 |
RBS Group Annual Report and Accounts 200918
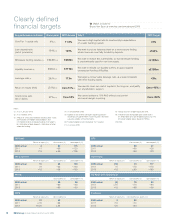
Clearly defined
financial targets dWatch or listen to
Bruce Van Saun at www.rbs.com/annualreport2009
Why?
We need a high capital ratio to meet society’s expectations
of a safer banking system.
We want to put our balance sheet on a more secure footing,
where loans are near fully funded by deposits.
We want to reduce this vulnerability, so that wholesale funding
is predominantly used for non-loan assets.
We want to rebuild our liquidity buffers, to guard against
unexpected funding difficulties.
We target a conservative leverage ratio, at a level consistent
with other leading banks.
We need to cover our cost of capital in the long-run, and justify
our shareholders’ support.
We cannot achieve a 15% RoE without cost control
and asset margin re-pricing.
2013 Target
>8%
c100%
<£150bn
c£150bn
<20x
Core >15% (9)
Core <50%
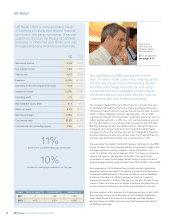
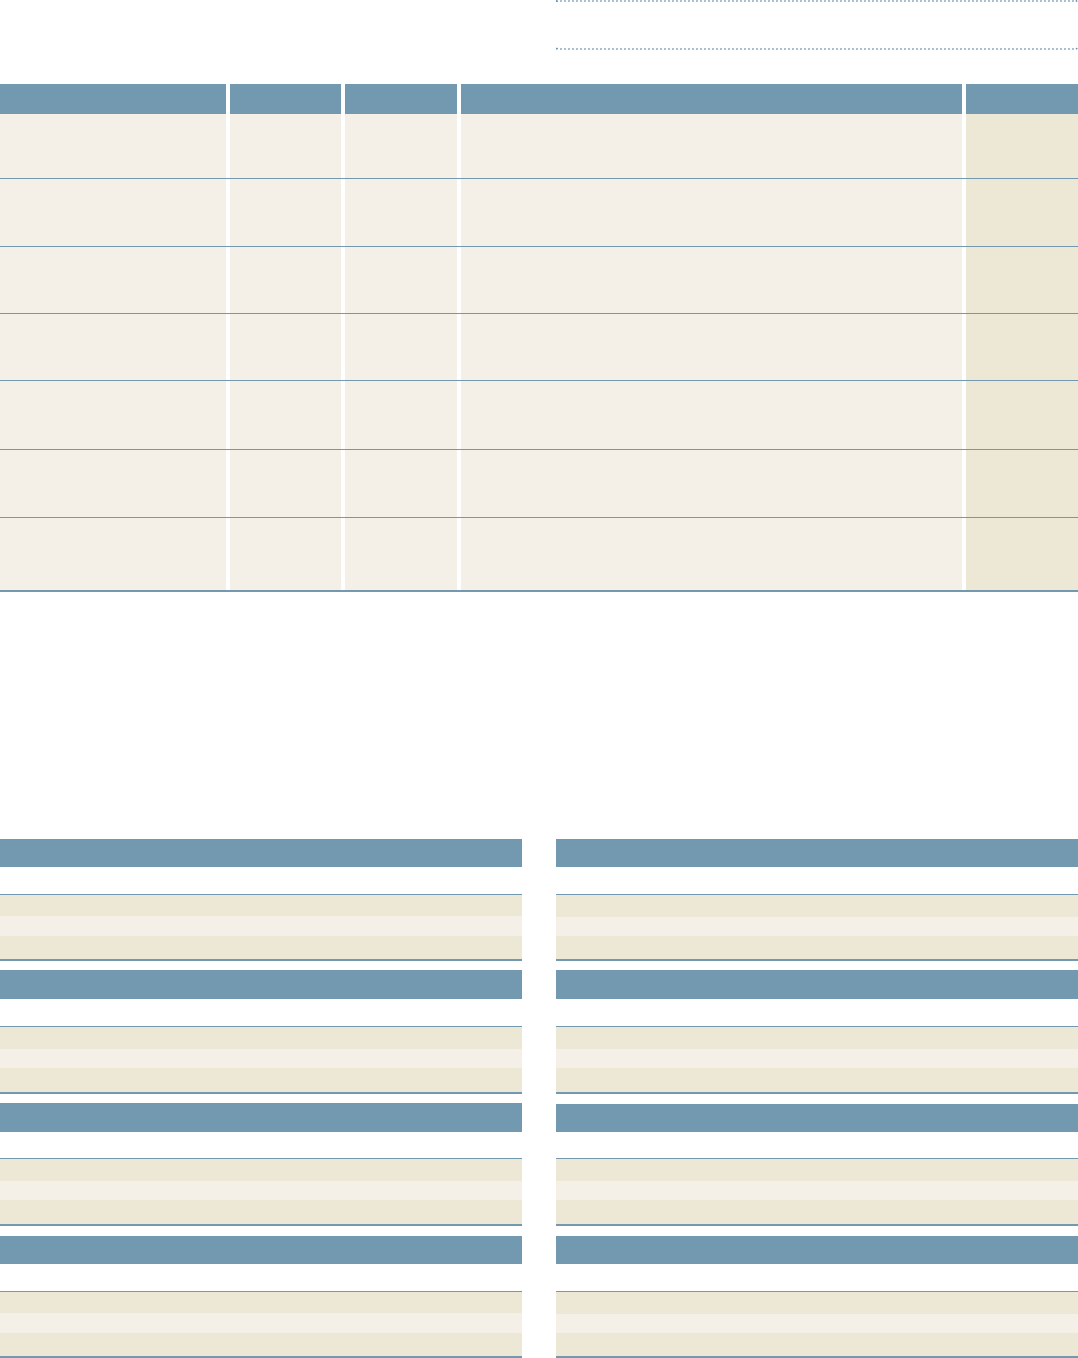
UK Retail
Return on equity (%) Cost:income (%) Loan:deposit (%)
2009 actual 4 60 115
2011 >1 <60 <120
2013 >15 c.50 <105
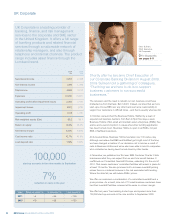
UK Corporate
Return on equity (%) Cost:income (%) Loan:deposit (%)
2009 actual 10 43 126
2011 >5 <45 <135
2013 >15 <35 <130
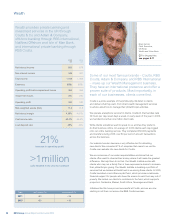
Wealth
Cost:income (%) Loan:deposit (%)
2009 actual 59 38
2011 <60 <35
2013 <50 <30
GBM
Return on equity (%) Cost: income (%)
2009 actual 31 42
2011 c.15 <65
2013 15-20 c.55
GTS
Cost:income (%) Loan:deposit (%)
2009 actual 59 21
2011 <60 <25
2013 <50 <20
Ulster Bank
Return on equity (%) Cost:income (%) Loan:deposit (%)
2009 actual (13) 73 177
2011 >0 <75 <175
2013 >15 c.50 <150
US Retail and Commercial
Return on equity (%) Cost:income (%) Loan:deposit (%)
2009 actual (2) 78 80
2011 c.10 <70 <90
2013 >15 <55 <90
Insurance
Return on equity (%) Cost:income less claims (%)
2009 actual 2 92
2011 >15 <70
2013 >20 <60
Worst point
4% (1)
154% (2)
£343bn (4)
£90bn (4)
28.7x (7)
(31%) (8)
97% (10)
Key performance indicator
Core Tier 1 capital ratio
Loan:deposit ratio
(net of provisions)
Wholesale funding reliance (3)
Liquidity reserves (5)
Leverage ratio (6)
Return on equity (RoE)
Cost:income ratio
net of claims
2009 Actuals
11.0%
135%
£250bn
£171bn
17.0x
Core 13% (9)
Core 53%
Notes:
(1) As at 1 January 2008.
(2) As at October 2008.
(3) Amount of unsecured wholesale funding under 1 year.
2009 includes £109 billion of bank deposits and
£141 billion of other wholesale funding. 2013 target is
for <£65 billion of bank deposits, <£85 billion of other
wholesale funding.
(4) As at December 2008.
(5) Eligible assets held for contingent liquidity purposes
including cash, government issued securities and other
securities eligible with central banks.
(6) Funded tangible assets divided by Tier 1 capital.
(7) As at June 2008.
(8) Group return on tangible equity for 2008.
(9) Indicative Core attributable profit taxed at 28%
on attributable core spot tangible equity (circa 70%
of Group tangible equity based on RWAs).
(10) 2008.