RBS 2009 Annual Report Download - page 243
Download and view the complete annual report
Please find page 243 of the 2009 RBS annual report below. You can navigate through the pages in the report by either clicking on the pages listed below, or by using the keyword search tool below to find specific information within the annual report.-
 1
1 -
2
-
3
-
4
-
5
-
6
-
7
-
8
-
9
-
10
-
11
-
12
-
13
-
14
-
15
-
16
-
17
-
18
-
19
-
20
-
21
-
22
-
23
-
24
-
25
-
26
-
27
-
28
-
29
-
30
-
31
-
32
-
33
-
34
-
35
-
36
-
37
-
38
-
39
-
40
-
41
-
42
-
43
-
44
-
45
-
46
-
47
-
48
-
49
-
50
-
51
-
52
-
53
-
54
-
55
-
56
-
57
-
58
-
59
-
60
-
61
-
62
-
63
-
64
-
65
-
66
-
67
-
68
-
69
-
70
-
71
-
72
-
73
-
74
-
75
-
76
-
77
-
78
-
79
-
80
-
81
-
82
-
83
-
84
-
85
-
86
-
87
-
88
-
89
-
90
-
91
-
92
-
93
-
94
-
95
-
96
-
97
-
98
-
99
-
100
-
101
-
102
-
103
-
104
-
105
-
106
-
107
-
108
-
109
-
110
-
111
-
112
-
113
-
114
-
115
-
116
-
117
-
118
-
119
-
120
-
121
-
122
-
123
-
124
-
125
-
126
-
127
-
128
-
129
-
130
-
131
-
132
-
133
-
134
-
135
-
136
-
137
-
138
-
139
-
140
-
141
-
142
-
143
-
144
-
145
-
146
-
147
-
148
-
149
-
150
-
151
-
152
-
153
-
154
-
155
-
156
-
157
-
158
-
159
-
160
-
161
-
162
-
163
-
164
-
165
-
166
-
167
-
168
-
169
-
170
-
171
-
172
-
173
-
174
-
175
-
176
-
177
-
178
-
179
-
180
-
181
-
182
-
183
-
184
-
185
-
186
-
187
-
188
-
189
-
190
-
191
-
192
-
193
-
194
-
195
-
196
-
197
-
198
-
199
-
200
-
201
-
202
-
203
-
204
-
205
-
206
-
207
-
208
-
209
-
210
-
211
-
212
-
213
-
214
-
215
-
216
-
217
-
218
-
219
-
220
-
221
-
222
-
223
-
224
-
225
-
226
-
227
-
228
-
229
-
230
-
231
-
232
-
 233
233 -
 234
234 -
 235
235 -
 236
236 -
 237
237 -
 238
238 -
 239
239 -
 240
240 -
 241
241 -
 242
242 -
 243
243 -
 244
244 -
 245
245 -
 246
246 -
 247
247 -
 248
248 -
 249
249 -
 250
250 -
 251
251 -
 252
252 -
 253
253 -
254
-
255
-
256
-
257
-
258
-
259
-
260
-
261
-
262
-
263
-
264
-
265
-
266
-
267
-
268
-
269
-
270
-
271
-
272
-
273
-
274
-
275
-
276
-
277
-
278
-
279
-
280
-
281
-
282
-
283
-
284
-
285
-
286
-
287
-
288
-
289
-
290
-
291
-
292
-
293
-
294
-
295
-
296
-
297
-
298
-
299
-
300
-
301
-
302
-
303
-
304
-
305
-
306
-
307
-
308
-
309
-
310
-
311
-
312
-
313
-
314
-
315
-
316
-
317
-
318
-
319
-
320
-
321
-
322
-
323
-
324
-
325
-
326
-
327
-
328
-
329
-
330
-
331
-
332
-
333
-
334
-
335
-
336
-
337
-
338
-
339
-
340
-
341
-
342
-
343
-
344
-
345
-
346
-
347
-
348
-
349
-
350
-
351
-
352
-
353
-
354
-
355
-
356
-
357
-
358
-
359
-
360
-
361
-
362
-
363
-
364
-
365
-
366
-
367
-
368
-
369
-
370
-
371
-
372
-
373
-
374
-
375
-
376
-
377
-
378
-
379
-
380
-
381
-
382
-
383
-
384
-
385
-
386
-
387
-
388
-
389
-
390
 |
 |

Financial statements
241RBS Group Annual Report and Accounts 2009
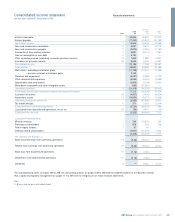
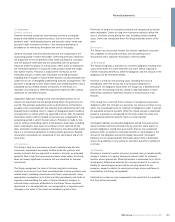
Consolidated income statement
for the year ended 31 December 2009
Restated
2009 2008 2007
Note £m £m £m
Interest receivable 33,836 49,522 32,252
Interest payable (17,332) (30,847) (20,183)
Net interest income 116,504 18,675 12,069
Fees and commissions receivable 29,831 9,831 8,278
Fees and commissions payable 2(2,822) (2,386) (2,193)
Income/(loss) from trading activities 23,881 (8,477) 1,292
Gain on redemption of own debt 23,790 ——
Other operating income (excluding insurance premium income) 21,962 1,899 4,833
Insurance net premium income 24 5,544 6,326 6,087
Non-interest income 22,186 7,193 18,297
Total income 38,690 25,868 30,366
Staff costs – excluding curtailment gains (11,783) (10,410) (7,338)
– pension schemes curtailment gains 2,148 ——
Premises and equipment (3,087) (2,593) (1,703)
Other administrative expenses (5,584) (5,464) (2,969)
Depreciation and amortisation (2,809) (3,154) (1,932)
Write-down of goodwill and other intangible assets (363) (32,581) —
Operating expenses 3(21,478) (54,202) (13,942)
Profit/(loss) before other operating charges and impairment losses 17,212 (28,334) 16,424
Insurance net claims 24 (4,857) (4,430) (4,624)
Impairment losses 12 (14,950) (8,072) (1,968)
Operating (loss)/profit before tax (2,595) (40,836) 9,832
Tax credit/(charge) 6371 2,323 (2,044)
(Loss)/profit from continuing operations (2,224) (38,513) 7,788
(Loss)/profit from discontinued operations, net of tax 20 (99) 3,971 (76)
(Loss)/profit for the year (2,323) (34,542) 7,712
(Loss)/profit attributable to:
Minority interests 349 (10,832) 163
Preference shareholders 7878 536 246
Paid-in equity holders 757 60 —
Ordinary and B shareholders (3,607) (24,306) 7,303
(2,323) (34,542) 7,712
Per ordinary and B share (1) :
Basic (loss)/earnings from continuing operations 10 (6.3p) (146.2p) 64.0p
Diluted (loss)/earnings from continuing operations 10 (6.3p) (146.2p) 63.4p
Basic loss from discontinued operations 10 (0.1p) (0.5p) —
Diluted loss from discontinued operations 10 (0.1p) (0.5p) —
Dividends 8—19.3p 27.0p
The accompanying notes on pages 259 to 348, the accounting policies on pages 248 to 258 and the audited sections of the Business review:
Risk, capital and liquidity management on pages 117 to 206 form an integral part of these financial statements.
Note:
(1) B shares rank pari-passu with ordinary shares.