RBS 2009 Annual Report Download - page 348
Download and view the complete annual report
Please find page 348 of the 2009 RBS annual report below. You can navigate through the pages in the report by either clicking on the pages listed below, or by using the keyword search tool below to find specific information within the annual report.-
 1
1 -
2
-
3
-
4
-
5
-
6
-
7
-
8
-
9
-
10
-
11
-
12
-
13
-
14
-
15
-
16
-
17
-
18
-
19
-
20
-
21
-
22
-
23
-
24
-
25
-
26
-
27
-
28
-
29
-
30
-
31
-
32
-
33
-
34
-
35
-
36
-
37
-
38
-
39
-
40
-
41
-
42
-
43
-
44
-
45
-
46
-
47
-
48
-
49
-
50
-
51
-
52
-
53
-
54
-
55
-
56
-
57
-
58
-
59
-
60
-
61
-
62
-
63
-
64
-
65
-
66
-
67
-
68
-
69
-
70
-
71
-
72
-
73
-
74
-
75
-
76
-
77
-
78
-
79
-
80
-
81
-
82
-
83
-
84
-
85
-
86
-
87
-
88
-
89
-
90
-
91
-
92
-
93
-
94
-
95
-
96
-
97
-
98
-
99
-
100
-
101
-
102
-
103
-
104
-
105
-
106
-
107
-
108
-
109
-
110
-
111
-
112
-
113
-
114
-
115
-
116
-
117
-
118
-
119
-
120
-
121
-
122
-
123
-
124
-
125
-
126
-
127
-
128
-
129
-
130
-
131
-
132
-
133
-
134
-
135
-
136
-
137
-
138
-
139
-
140
-
141
-
142
-
143
-
144
-
145
-
146
-
147
-
148
-
149
-
150
-
151
-
152
-
153
-
154
-
155
-
156
-
157
-
158
-
159
-
160
-
161
-
162
-
163
-
164
-
165
-
166
-
167
-
168
-
169
-
170
-
171
-
172
-
173
-
174
-
175
-
176
-
177
-
178
-
179
-
180
-
181
-
182
-
183
-
184
-
185
-
186
-
187
-
188
-
189
-
190
-
191
-
192
-
193
-
194
-
195
-
196
-
197
-
198
-
199
-
200
-
201
-
202
-
203
-
204
-
205
-
206
-
207
-
208
-
209
-
210
-
211
-
212
-
213
-
214
-
215
-
216
-
217
-
218
-
219
-
220
-
221
-
222
-
223
-
224
-
225
-
226
-
227
-
228
-
229
-
230
-
231
-
232
-
233
-
234
-
235
-
236
-
237
-
238
-
239
-
240
-
241
-
242
-
243
-
244
-
245
-
246
-
247
-
248
-
249
-
250
-
251
-
252
-
253
-
254
-
255
-
256
-
257
-
258
-
259
-
260
-
261
-
262
-
263
-
264
-
265
-
266
-
267
-
268
-
269
-
270
-
271
-
272
-
273
-
274
-
275
-
276
-
277
-
278
-
279
-
280
-
281
-
282
-
283
-
284
-
285
-
286
-
287
-
288
-
289
-
290
-
291
-
292
-
293
-
294
-
295
-
296
-
297
-
298
-
299
-
300
-
301
-
302
-
303
-
304
-
305
-
306
-
307
-
308
-
309
-
310
-
311
-
312
-
313
-
314
-
315
-
316
-
317
-
318
-
319
-
320
-
321
-
322
-
323
-
324
-
325
-
326
-
327
-
328
-
329
-
330
-
331
-
332
-
333
-
334
-
335
-
336
-
337
-
 338
338 -
 339
339 -
 340
340 -
 341
341 -
 342
342 -
 343
343 -
 344
344 -
 345
345 -
 346
346 -
 347
347 -
 348
348 -
 349
349 -
 350
350 -
 351
351 -
 352
352 -
 353
353 -
 354
354 -
 355
355 -
 356
356 -
 357
357 -
 358
358 -
359
-
360
-
361
-
362
-
363
-
364
-
365
-
366
-
367
-
368
-
369
-
370
-
371
-
372
-
373
-
374
-
375
-
376
-
377
-
378
-
379
-
380
-
381
-
382
-
383
-
384
-
385
-
386
-
387
-
388
-
389
-
390
 |
 |

RBS Group Annual Report and Accounts 2009346
Notes on the accounts continued
38 Segmental analysis continued
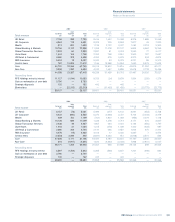
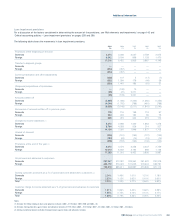
Group
Rest of
UK USA Europe the World Total
2007 £m £m £m £m £m
Total revenue 33,743 8,570 8,140 2,578 53,031
Net interest income 8,350 2,054 1,510 155 12,069
Net fees and commissions 3,933 1,176 560 416 6,085
Income/(loss) from trading activities 1,252 (486) 348 178 1,292
Other operating income 3,844 260 587 142 4,833
Insurance premium income (net of reinsurers’ share) 5,562 — 525 — 6,087
Total income 22,941 3,004 3,530 891 30,366
Operating profit before tax 7,761 719 1,136 216 9,832
Total assets 938,064 340,170 422,058 140,537 1,840,829
Total liabilities 902,340 326,499 392,362 128,202 1,749,403
Net assets attributable to equity owners and minority interests 35,724 13,671 29,696 12,335 91,426
Contingent liabilities and commitments 197,637 95,547 82,316 24,599 400,099
Cost to acquire property, plant and equipment and intangible assets 3,305 238 1,793 225 5,561
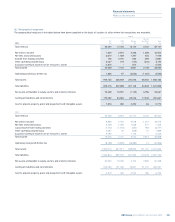
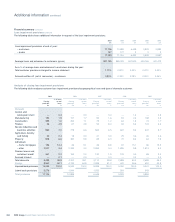
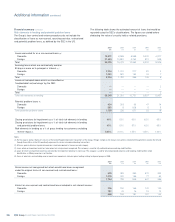
39 Directors’ and key management remuneration Group
2009 2008
Directors’ remuneration £000 £000
Non-executive directors – emoluments 823 1,408
Chairmen and executive directors – emoluments 4,971 7,132
– contributions and allowances in respect of defined
contribution pension schemes — 3
5,794 8,543
– amounts receivable under long-term incentive plans 1,103 646
– gains on exercise of share options — 77
6,897 9,266
Retirement benefits are accruing to one director (2008 – one) under defined benefit schemes. No directors (2008 – nil) are accruing benefits under
defined contribution schemes.
The executive directors may also participate in the company’s executive share option and sharesave schemes and details of their interests in the
company’s shares arising from their participation are given on page 233. Details of the remuneration received by each director during the year and
each director’s pension arrangements are given on pages 232 to 236.
Compensation of key management
The aggregate remuneration of directors and other members of key management during the year was as follows:
Group
2009 2008
£000 £000
Short-term benefits 29,292 16,813
Post-employment benefits 9,781 13,174
Other long-term benefits —496
Termination benefits —345
Share-based payments 8,953 2,078
48,026 32,906