RBS 2009 Annual Report Download - page 101
Download and view the complete annual report
Please find page 101 of the 2009 RBS annual report below. You can navigate through the pages in the report by either clicking on the pages listed below, or by using the keyword search tool below to find specific information within the annual report.-
 1
1 -
2
-
3
-
4
-
5
-
6
-
7
-
8
-
9
-
10
-
11
-
12
-
13
-
14
-
15
-
16
-
17
-
18
-
19
-
20
-
21
-
22
-
23
-
24
-
25
-
26
-
27
-
28
-
29
-
30
-
31
-
32
-
33
-
34
-
35
-
36
-
37
-
38
-
39
-
40
-
41
-
42
-
43
-
44
-
45
-
46
-
47
-
48
-
49
-
50
-
51
-
52
-
53
-
54
-
55
-
56
-
57
-
58
-
59
-
60
-
61
-
62
-
63
-
64
-
65
-
66
-
67
-
68
-
69
-
70
-
71
-
72
-
73
-
74
-
75
-
76
-
77
-
78
-
79
-
80
-
81
-
82
-
83
-
84
-
85
-
86
-
87
-
88
-
89
-
90
-
 91
91 -
 92
92 -
 93
93 -
 94
94 -
 95
95 -
 96
96 -
 97
97 -
 98
98 -
 99
99 -
 100
100 -
 101
101 -
 102
102 -
 103
103 -
 104
104 -
 105
105 -
 106
106 -
 107
107 -
 108
108 -
 109
109 -
 110
110 -
 111
111 -
112
-
113
-
114
-
115
-
116
-
117
-
118
-
119
-
120
-
121
-
122
-
123
-
124
-
125
-
126
-
127
-
128
-
129
-
130
-
131
-
132
-
133
-
134
-
135
-
136
-
137
-
138
-
139
-
140
-
141
-
142
-
143
-
144
-
145
-
146
-
147
-
148
-
149
-
150
-
151
-
152
-
153
-
154
-
155
-
156
-
157
-
158
-
159
-
160
-
161
-
162
-
163
-
164
-
165
-
166
-
167
-
168
-
169
-
170
-
171
-
172
-
173
-
174
-
175
-
176
-
177
-
178
-
179
-
180
-
181
-
182
-
183
-
184
-
185
-
186
-
187
-
188
-
189
-
190
-
191
-
192
-
193
-
194
-
195
-
196
-
197
-
198
-
199
-
200
-
201
-
202
-
203
-
204
-
205
-
206
-
207
-
208
-
209
-
210
-
211
-
212
-
213
-
214
-
215
-
216
-
217
-
218
-
219
-
220
-
221
-
222
-
223
-
224
-
225
-
226
-
227
-
228
-
229
-
230
-
231
-
232
-
233
-
234
-
235
-
236
-
237
-
238
-
239
-
240
-
241
-
242
-
243
-
244
-
245
-
246
-
247
-
248
-
249
-
250
-
251
-
252
-
253
-
254
-
255
-
256
-
257
-
258
-
259
-
260
-
261
-
262
-
263
-
264
-
265
-
266
-
267
-
268
-
269
-
270
-
271
-
272
-
273
-
274
-
275
-
276
-
277
-
278
-
279
-
280
-
281
-
282
-
283
-
284
-
285
-
286
-
287
-
288
-
289
-
290
-
291
-
292
-
293
-
294
-
295
-
296
-
297
-
298
-
299
-
300
-
301
-
302
-
303
-
304
-
305
-
306
-
307
-
308
-
309
-
310
-
311
-
312
-
313
-
314
-
315
-
316
-
317
-
318
-
319
-
320
-
321
-
322
-
323
-
324
-
325
-
326
-
327
-
328
-
329
-
330
-
331
-
332
-
333
-
334
-
335
-
336
-
337
-
338
-
339
-
340
-
341
-
342
-
343
-
344
-
345
-
346
-
347
-
348
-
349
-
350
-
351
-
352
-
353
-
354
-
355
-
356
-
357
-
358
-
359
-
360
-
361
-
362
-
363
-
364
-
365
-
366
-
367
-
368
-
369
-
370
-
371
-
372
-
373
-
374
-
375
-
376
-
377
-
378
-
379
-
380
-
381
-
382
-
383
-
384
-
385
-
386
-
387
-
388
-
389
-
390
 |
 |

99RBS Group Annual Report and Accounts 2009
Business review
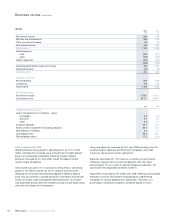
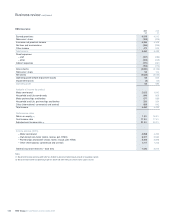
2009 compared with 2008
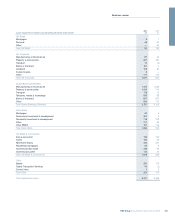
The recessionary economic environment, historically low interest rates
and deteriorating credit conditions resulted in an operating loss of $174
million. However, the business has now successfully refocused on its
core customer franchises in New England, the Mid-Atlantic region and
the Midwest.
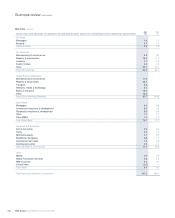
The division achieved very strong growth in mortgage origination
volumes, with significantly higher penetration through the branch
network and improved profitability, particularly on recent origination
vintages. Cross-selling of card, deposit and checking account products
has increased substantially, with over 65% of new mortgage customers
also taking out a checking account. The division has also increased
commercial banking market penetration, with lead bank share within its
footprint increasing from 6% to 7% in the $5 million to $25 million
segment and from 6% to 8% in the $25 million to $500 million segment.
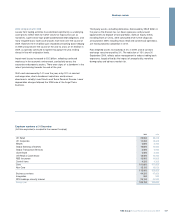
Net interest income was down 13%. Net interest margin was down
31bps for the full year, reflecting the decline in deposit margins resulting
from the low interest rate environment, though margins have been
partially rebuilt in the second half from the lows experienced in the first
half, as the business repriced lending rates and aggressively reduced
pricing on term and time deposits.
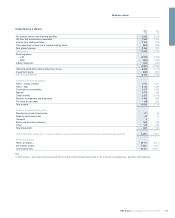
Expenses increased by 11%, reflecting increased FDIC deposit
insurance levies, higher employee benefit costs as well as increased
costs relating to loan workout and collection activity. Successful
execution of restructuring activities resulted in approximately $75 million
of cost savings.
Impairment losses increased to $1,099 million as charge-offs climbed to
0.90% of loans, an increase of 34bps compared with 2008.
Loans and advances were down 12%, reflecting subdued customer
demand.
Customer deposits increased 4% from the prior year. The deposit mix
improved significantly, with strong growth in checking balances
combined with migration away from higher priced term and time
deposits as the division adjusted its pricing strategies. Over 58,000
consumer checking accounts were added over the course of the year,
and more than 13,000 small business checking accounts. Consumer
checking balances grew by 8% and small business balances by 12%.