RBS 2009 Annual Report Download - page 177
Download and view the complete annual report
Please find page 177 of the 2009 RBS annual report below. You can navigate through the pages in the report by either clicking on the pages listed below, or by using the keyword search tool below to find specific information within the annual report.-
 1
1 -
2
-
3
-
4
-
5
-
6
-
7
-
8
-
9
-
10
-
11
-
12
-
13
-
14
-
15
-
16
-
17
-
18
-
19
-
20
-
21
-
22
-
23
-
24
-
25
-
26
-
27
-
28
-
29
-
30
-
31
-
32
-
33
-
34
-
35
-
36
-
37
-
38
-
39
-
40
-
41
-
42
-
43
-
44
-
45
-
46
-
47
-
48
-
49
-
50
-
51
-
52
-
53
-
54
-
55
-
56
-
57
-
58
-
59
-
60
-
61
-
62
-
63
-
64
-
65
-
66
-
67
-
68
-
69
-
70
-
71
-
72
-
73
-
74
-
75
-
76
-
77
-
78
-
79
-
80
-
81
-
82
-
83
-
84
-
85
-
86
-
87
-
88
-
89
-
90
-
91
-
92
-
93
-
94
-
95
-
96
-
97
-
98
-
99
-
100
-
101
-
102
-
103
-
104
-
105
-
106
-
107
-
108
-
109
-
110
-
111
-
112
-
113
-
114
-
115
-
116
-
117
-
118
-
119
-
120
-
121
-
122
-
123
-
124
-
125
-
126
-
127
-
128
-
129
-
130
-
131
-
132
-
133
-
134
-
135
-
136
-
137
-
138
-
139
-
140
-
141
-
142
-
143
-
144
-
145
-
146
-
147
-
148
-
149
-
150
-
151
-
152
-
153
-
154
-
155
-
156
-
157
-
158
-
159
-
160
-
161
-
162
-
163
-
164
-
165
-
166
-
 167
167 -
 168
168 -
 169
169 -
 170
170 -
 171
171 -
 172
172 -
 173
173 -
 174
174 -
 175
175 -
 176
176 -
 177
177 -
 178
178 -
 179
179 -
 180
180 -
 181
181 -
 182
182 -
 183
183 -
 184
184 -
 185
185 -
 186
186 -
 187
187 -
188
-
189
-
190
-
191
-
192
-
193
-
194
-
195
-
196
-
197
-
198
-
199
-
200
-
201
-
202
-
203
-
204
-
205
-
206
-
207
-
208
-
209
-
210
-
211
-
212
-
213
-
214
-
215
-
216
-
217
-
218
-
219
-
220
-
221
-
222
-
223
-
224
-
225
-
226
-
227
-
228
-
229
-
230
-
231
-
232
-
233
-
234
-
235
-
236
-
237
-
238
-
239
-
240
-
241
-
242
-
243
-
244
-
245
-
246
-
247
-
248
-
249
-
250
-
251
-
252
-
253
-
254
-
255
-
256
-
257
-
258
-
259
-
260
-
261
-
262
-
263
-
264
-
265
-
266
-
267
-
268
-
269
-
270
-
271
-
272
-
273
-
274
-
275
-
276
-
277
-
278
-
279
-
280
-
281
-
282
-
283
-
284
-
285
-
286
-
287
-
288
-
289
-
290
-
291
-
292
-
293
-
294
-
295
-
296
-
297
-
298
-
299
-
300
-
301
-
302
-
303
-
304
-
305
-
306
-
307
-
308
-
309
-
310
-
311
-
312
-
313
-
314
-
315
-
316
-
317
-
318
-
319
-
320
-
321
-
322
-
323
-
324
-
325
-
326
-
327
-
328
-
329
-
330
-
331
-
332
-
333
-
334
-
335
-
336
-
337
-
338
-
339
-
340
-
341
-
342
-
343
-
344
-
345
-
346
-
347
-
348
-
349
-
350
-
351
-
352
-
353
-
354
-
355
-
356
-
357
-
358
-
359
-
360
-
361
-
362
-
363
-
364
-
365
-
366
-
367
-
368
-
369
-
370
-
371
-
372
-
373
-
374
-
375
-
376
-
377
-
378
-
379
-
380
-
381
-
382
-
383
-
384
-
385
-
386
-
387
-
388
-
389
-
390
 |
 |

Business review
Risk, capital and liquidity management
175RBS Group Annual Report and Accounts 2009
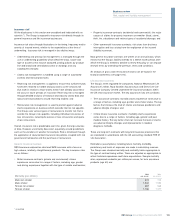
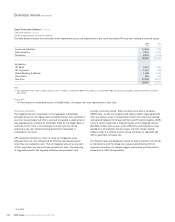
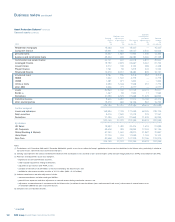
Covered assets
Roll forward to 31 December 2009
The table below details the movement in covered assets in the year.
£bn
Covered assets at 31 December 2008 – at accession to the Scheme 282.0
Disposals (3.0)
Non-contractual early repayments (8.9)
Amortisations (9.4)
Maturities (16.7)
Rollovers and covered amount cap adjustments (1.7)
Effect of foreign currency movements (11.8)
Covered assets at 31 December 2009 230.5
Note:
(1) The covered amount at 31 December 2009 above includes approximately £2.1 billion of assets in the derivatives and structured finance asset classes which, for technical reasons, do not currently
satisfy, or are anticipated at some stage not to satisfy, the eligibility requirements of the Scheme. HMT and the Group continue to negotiate in good faith whether (and, if so, to what extent)
coverage should extend to these assets. Also, the Group and HMT are in discussion over the HMT classifications of some structured credit assets and this may result in adjustments to amounts for
some asset classes; however underlying risks will be unchanged.
Key points
•The majority of the reduction (68%) in the covered assets reflects
repayments by customers.
•Additionally the Group took advantage of market conditions and
executed a number of loan sales.
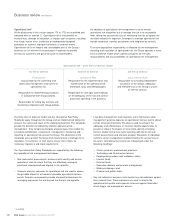
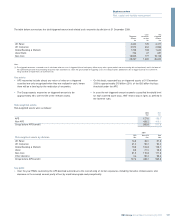
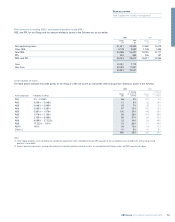
The approach for high volume commercial and retail exposures was on a portfolio basis. Selection for large corporates and GBM was at the
counterparty/asset level. Set out below are the selection criteria for the contributing divisions.
Global Banking Banking book: selection by individual asset pool (corporate loans, real estate finance, and leveraged finance),
Markets (GBM) (1) Global Restructuring Group work-out unit counterparties/assets and high risk counterparties/assets.
Additional counterparties/assets were selected through an individual risk review of the total portfolio.
Trading book: selection by individual assets (monolines, derivatives, mortgage trading).
UK Corporate (1) Commercial & corporate real estate: all defaulted assets in the work-out/restructuring unit or in high risk bands.
Corporate: all defaulted assets in the work-out/restructuring unit. Corporate banking clients in high risk sectors or with
high concentration risk.
Business Banking: portfolios in the work out/restructuring unit or in high risk bands.
UK Retail (1) Mortgages: assets with a higher loan-to-value (LTV) and in higher risk segments (e.g. LTV >97% on general book,
LTV >85% on buy-to-let book), and those assets in arrears (at 31 December 2008).
Loans and overdrafts: higher risk customers based on internal bandings, and those assets in arrears
(at 31 December 2008).
Ulster Bank (1) Mortgages: assets with greater than 85% LTV, broker mortgages and interest only with a higher probability of default.
(Corporate & Retail) Retail: portfolios of accounts in default, >1 month arrears, <2 years old and a higher probability of default.
Corporate: counterparties/assets in work-out/restructuring groups or in high risk bands, and other assets identified
as part of an individual review of cases.
Note:
(1) Including assets transferred to Non-Core division.