RBS 2009 Annual Report Download - page 178
Download and view the complete annual report
Please find page 178 of the 2009 RBS annual report below. You can navigate through the pages in the report by either clicking on the pages listed below, or by using the keyword search tool below to find specific information within the annual report.-
 1
1 -
2
-
3
-
4
-
5
-
6
-
7
-
8
-
9
-
10
-
11
-
12
-
13
-
14
-
15
-
16
-
17
-
18
-
19
-
20
-
21
-
22
-
23
-
24
-
25
-
26
-
27
-
28
-
29
-
30
-
31
-
32
-
33
-
34
-
35
-
36
-
37
-
38
-
39
-
40
-
41
-
42
-
43
-
44
-
45
-
46
-
47
-
48
-
49
-
50
-
51
-
52
-
53
-
54
-
55
-
56
-
57
-
58
-
59
-
60
-
61
-
62
-
63
-
64
-
65
-
66
-
67
-
68
-
69
-
70
-
71
-
72
-
73
-
74
-
75
-
76
-
77
-
78
-
79
-
80
-
81
-
82
-
83
-
84
-
85
-
86
-
87
-
88
-
89
-
90
-
91
-
92
-
93
-
94
-
95
-
96
-
97
-
98
-
99
-
100
-
101
-
102
-
103
-
104
-
105
-
106
-
107
-
108
-
109
-
110
-
111
-
112
-
113
-
114
-
115
-
116
-
117
-
118
-
119
-
120
-
121
-
122
-
123
-
124
-
125
-
126
-
127
-
128
-
129
-
130
-
131
-
132
-
133
-
134
-
135
-
136
-
137
-
138
-
139
-
140
-
141
-
142
-
143
-
144
-
145
-
146
-
147
-
148
-
149
-
150
-
151
-
152
-
153
-
154
-
155
-
156
-
157
-
158
-
159
-
160
-
161
-
162
-
163
-
164
-
165
-
166
-
167
-
 168
168 -
 169
169 -
 170
170 -
 171
171 -
 172
172 -
 173
173 -
 174
174 -
 175
175 -
 176
176 -
 177
177 -
 178
178 -
 179
179 -
 180
180 -
 181
181 -
 182
182 -
 183
183 -
 184
184 -
 185
185 -
 186
186 -
 187
187 -
 188
188 -
189
-
190
-
191
-
192
-
193
-
194
-
195
-
196
-
197
-
198
-
199
-
200
-
201
-
202
-
203
-
204
-
205
-
206
-
207
-
208
-
209
-
210
-
211
-
212
-
213
-
214
-
215
-
216
-
217
-
218
-
219
-
220
-
221
-
222
-
223
-
224
-
225
-
226
-
227
-
228
-
229
-
230
-
231
-
232
-
233
-
234
-
235
-
236
-
237
-
238
-
239
-
240
-
241
-
242
-
243
-
244
-
245
-
246
-
247
-
248
-
249
-
250
-
251
-
252
-
253
-
254
-
255
-
256
-
257
-
258
-
259
-
260
-
261
-
262
-
263
-
264
-
265
-
266
-
267
-
268
-
269
-
270
-
271
-
272
-
273
-
274
-
275
-
276
-
277
-
278
-
279
-
280
-
281
-
282
-
283
-
284
-
285
-
286
-
287
-
288
-
289
-
290
-
291
-
292
-
293
-
294
-
295
-
296
-
297
-
298
-
299
-
300
-
301
-
302
-
303
-
304
-
305
-
306
-
307
-
308
-
309
-
310
-
311
-
312
-
313
-
314
-
315
-
316
-
317
-
318
-
319
-
320
-
321
-
322
-
323
-
324
-
325
-
326
-
327
-
328
-
329
-
330
-
331
-
332
-
333
-
334
-
335
-
336
-
337
-
338
-
339
-
340
-
341
-
342
-
343
-
344
-
345
-
346
-
347
-
348
-
349
-
350
-
351
-
352
-
353
-
354
-
355
-
356
-
357
-
358
-
359
-
360
-
361
-
362
-
363
-
364
-
365
-
366
-
367
-
368
-
369
-
370
-
371
-
372
-
373
-
374
-
375
-
376
-
377
-
378
-
379
-
380
-
381
-
382
-
383
-
384
-
385
-
386
-
387
-
388
-
389
-
390
 |
 |

Business review continued
RBS Group Annual Report and Accounts 2009176
First loss utilisation
The triggered amount is equivalent to the aggregate outstanding
principal amount on the trigger date excluding interest, fees, premium or
any other non-principal sum that is accrued or payable, except where it
was capitalised on or before 31 December 2008. At the trigger date, in
economic terms, there is an exchange of assets, with the Group
receiving a two year interest bearing government receivable in
exchange for the asset.
APS recoveries include any return of value on a triggered asset,
although these are only recognised for Scheme reporting purposes
when they are realised in cash. The net triggered amount at any point
in time, only takes into account cash recoveries to date. The capturing
of triggered amounts has required extensive new processes and
controls to be put in place. These continue to be work in progress.
Additionally, as with any bespoke and highly complex legal agreement
there are various areas of interpretation which still need to be clarified
and agreed between the Group and the Asset Protection Agency (‘APA’),
some of which could have a material impact on the triggered amount
identified to date. Also as part of the APS terms and conditions it was
agreed to re-characterise certain assets and their closely related
hedges under the scheme and the Group continues to negotiate with
APA in good faith to finalise this.
The Scheme rules are designed to allow for data correction over the life
of the Scheme, and the Group has a grace period during 2010 to
implement processes to capture triggers and restate quarterly claims
statements to HMT retrospectively.
Asset Protection Scheme* continued
Covered assets continued
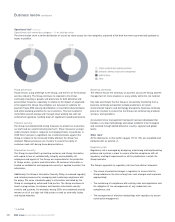
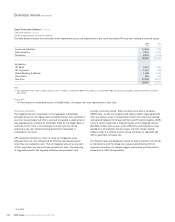
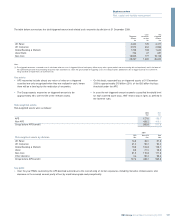
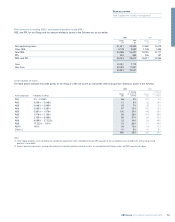
Credit impairments and write downs
The table below analyses the cumulative credit impairment losses and adjustments to par value (including AFS reserves) relating to covered assets:
2009 2008
£m £m
Loans and advances 14,240 7,705
Debt securities 7,816 7,942
Derivatives 6,834 6,575
28,890 22,222
By division:
UK Retail 2,431 1,492
UK Corporate 1,007 285
Global Banking & Markets 1,628 1,640
Ulster Bank 486 234
Non-Core 23,338 18,571
28,890 22,222
Note:
(1) Total available-for-sale reserves on debt securities of £1,113 million at 31 December 2009 (£1,315 million as at 31 December 2008 was previously included in undrawn commitments and other
adjustments).
Key point
•Of the increase in cumulative losses of £6,668 million, the largest was loan impairments in Non-Core.
* unaudited