RBS 2009 Annual Report Download - page 76
Download and view the complete annual report
Please find page 76 of the 2009 RBS annual report below. You can navigate through the pages in the report by either clicking on the pages listed below, or by using the keyword search tool below to find specific information within the annual report.-
 1
1 -
2
-
3
-
4
-
5
-
6
-
7
-
8
-
9
-
10
-
11
-
12
-
13
-
14
-
15
-
16
-
17
-
18
-
19
-
20
-
21
-
22
-
23
-
24
-
25
-
26
-
27
-
28
-
29
-
30
-
31
-
32
-
33
-
34
-
35
-
36
-
37
-
38
-
39
-
40
-
41
-
42
-
43
-
44
-
45
-
46
-
47
-
48
-
49
-
50
-
51
-
52
-
53
-
54
-
55
-
56
-
57
-
58
-
59
-
60
-
61
-
62
-
63
-
64
-
65
-
 66
66 -
 67
67 -
 68
68 -
 69
69 -
 70
70 -
 71
71 -
 72
72 -
 73
73 -
 74
74 -
 75
75 -
 76
76 -
 77
77 -
 78
78 -
 79
79 -
 80
80 -
 81
81 -
 82
82 -
 83
83 -
 84
84 -
 85
85 -
 86
86 -
87
-
88
-
89
-
90
-
91
-
92
-
93
-
94
-
95
-
96
-
97
-
98
-
99
-
100
-
101
-
102
-
103
-
104
-
105
-
106
-
107
-
108
-
109
-
110
-
111
-
112
-
113
-
114
-
115
-
116
-
117
-
118
-
119
-
120
-
121
-
122
-
123
-
124
-
125
-
126
-
127
-
128
-
129
-
130
-
131
-
132
-
133
-
134
-
135
-
136
-
137
-
138
-
139
-
140
-
141
-
142
-
143
-
144
-
145
-
146
-
147
-
148
-
149
-
150
-
151
-
152
-
153
-
154
-
155
-
156
-
157
-
158
-
159
-
160
-
161
-
162
-
163
-
164
-
165
-
166
-
167
-
168
-
169
-
170
-
171
-
172
-
173
-
174
-
175
-
176
-
177
-
178
-
179
-
180
-
181
-
182
-
183
-
184
-
185
-
186
-
187
-
188
-
189
-
190
-
191
-
192
-
193
-
194
-
195
-
196
-
197
-
198
-
199
-
200
-
201
-
202
-
203
-
204
-
205
-
206
-
207
-
208
-
209
-
210
-
211
-
212
-
213
-
214
-
215
-
216
-
217
-
218
-
219
-
220
-
221
-
222
-
223
-
224
-
225
-
226
-
227
-
228
-
229
-
230
-
231
-
232
-
233
-
234
-
235
-
236
-
237
-
238
-
239
-
240
-
241
-
242
-
243
-
244
-
245
-
246
-
247
-
248
-
249
-
250
-
251
-
252
-
253
-
254
-
255
-
256
-
257
-
258
-
259
-
260
-
261
-
262
-
263
-
264
-
265
-
266
-
267
-
268
-
269
-
270
-
271
-
272
-
273
-
274
-
275
-
276
-
277
-
278
-
279
-
280
-
281
-
282
-
283
-
284
-
285
-
286
-
287
-
288
-
289
-
290
-
291
-
292
-
293
-
294
-
295
-
296
-
297
-
298
-
299
-
300
-
301
-
302
-
303
-
304
-
305
-
306
-
307
-
308
-
309
-
310
-
311
-
312
-
313
-
314
-
315
-
316
-
317
-
318
-
319
-
320
-
321
-
322
-
323
-
324
-
325
-
326
-
327
-
328
-
329
-
330
-
331
-
332
-
333
-
334
-
335
-
336
-
337
-
338
-
339
-
340
-
341
-
342
-
343
-
344
-
345
-
346
-
347
-
348
-
349
-
350
-
351
-
352
-
353
-
354
-
355
-
356
-
357
-
358
-
359
-
360
-
361
-
362
-
363
-
364
-
365
-
366
-
367
-
368
-
369
-
370
-
371
-
372
-
373
-
374
-
375
-
376
-
377
-
378
-
379
-
380
-
381
-
382
-
383
-
384
-
385
-
386
-
387
-
388
-
389
-
390
 |
 |
RBS Group Annual Report and Accounts 200974
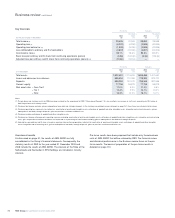
Business review continued
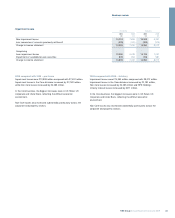
2009 compared with 2008 – pro forma
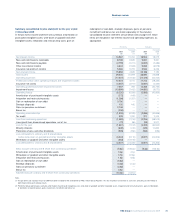
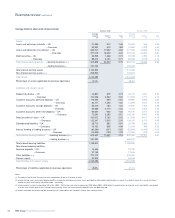
Operating loss
Group operating loss, excluding amortisation of purchased intangible
assets, write-down of goodwill and other intangible assets, integration
and restructuring costs, gain on redemption of own debt, strategic
disposals, gains on pensions curtailment and bonus tax was £6,232
million, compared with a loss of £6,938 million in 2008. The reduction in
the loss is primarily a result of a substantial increase in non-interest
income partially offset by a significant increase in impairment losses
and lower net interest income.
After amortisation of purchased intangible assets, write-down of goodwill
and other intangible assets, integration and restructuring costs, gain on
redemption of own debt, strategic disposals, gains on pensions
curtailment and bonus tax, the Group recorded a loss before tax of
£2,291 million, compared with a loss before tax of £25,207 million in 2008.
After tax, minority interests and preference share and other dividends,
the loss attributable to ordinary and B shareholders was £3,607 million,
compared with an attributable loss of £24,306 million in 2008.
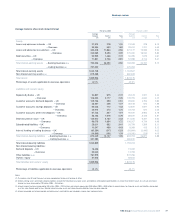
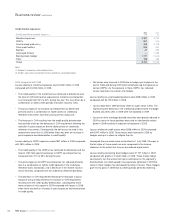
Total income
Total income, excluding the gain on redemption of own debt and
strategic disposals, increased by 43% to £29,425 million, primarily
reflecting a significant reduction in credit and other market losses.
Increased market volatility and strong customer demand in a positive
trading environment also contributed to this improvement. While income
was down marginally in UK Corporate and held steady in Retail &
Commercial Banking and RBS Insurance, a significant improvement
occurred in Global Banking & Markets, reflecting the reduced credit and
other market losses and a more buoyant trading market during the year
compared to 2008.
Net interest income
Net interest income fell by 14% to £13,567 million, with average loans
and advances to customers down 4% and average customer deposits
down 7%. Group net interest margin fell from 2.08% to 1.76% largely
reflecting the pressure on liability margins, given rates on many deposit
products already at floors in the low interest rate environment, and
strong competition, particularly for longer-term deposits and the build
up of the Group’s liquidity portfolio.
Non-interest income
Non-interest income increased to £15,858 million from £4,835 million in
2008, largely reflecting the sharp improvement in income from trading
activities, as improved asset valuations led to lower credit market losses
and GBM benefited from the restructuring of its business to focus on
core customer franchises. However, fees and commissions fell as a result
of the withdrawal of the single premium payment protection insurance
product and the restructuring of UK current account overdraft fees.
Operating expenses
Total operating expenses, excluding amortisation of purchased intangible
assets, write-down of goodwill and other intangible assets, integration
and restructuring costs, gains on pensions curtailment and bonus tax,
increased by 7% to £17,401 million, largely resulting from increased staff
costs. Staff costs were up 14% with most of the movement relating to
adverse movements in foreign exchange rates and some salary inflation.
Changes in incentive compensation, primarily in Global Banking &
Markets, represented most of the remaining change. The Group
cost:income ratio improved to 59%, compared with 79% in 2008.
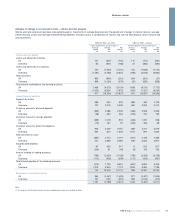
Impairment losses
Impairment losses increased to £13,899 million from £7,432 million in
2008, with Core bank impairments rising by £2,182 million and Non-
Core by £4,285 million. Signs that impairments might be plateauing
appear to have been borne out in the latter part of the year, and there
are indications that the pace of downwards credit rating migration for
corporates is slowing. Nonetheless, the financial circumstances of many
consumers and businesses remain fragile, and rising refinancing costs,
whether as a result of monetary tightening or of increased regulatory
capital requirements, could expose some customers to further difficulty.
Impairments represented 2.3% of gross loans and advances, excluding
reverse repos, in 2009 compared with 0.9% in 2008.
Risk elements in lending and potential problem loans at 31 December
2009 represented 6.1% of loans and advances, excluding reverse
repos, compared with 2.7% a year earlier. Provision coverage was 43%,
compared with 50% at 31 December 2008 as a consequence of the
growth in risk elements in lending being concentrated in secured,
property-related loans. These loans require relatively lower provisions in
view of their collateralised nature.
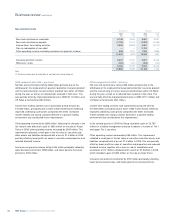
Other non-operating items
Integration and restructuring costs decreased, primarily as ABN AMRO
integration activity neared completion, partly offset by restructuring
activity following the conclusion of the strategic review.
In 2009 the Group recorded a gain of £3,790 million on a liability
management exercise to redeem a number of Tier 1 and upper Tier 2
securities. In addition, the overall gain on strategic disposals, £132
million, primarily relates to gains on the sale of Bank of China and Linea
Directa partially offset by losses arising from the sale of the Retail and
Commercial Asian businesses and Latin America asset portfolio.
Pension curtailment gains of £2,148 million were recognised during the
fourth quarter of 2009 arising from changes to prospective pension
benefits in the defined benefit scheme and certain other subsidiary
schemes. A charge related to the UK Government’s bonus tax proposals
of £208 million was reflected in 2009 with a further £160 million deferred
until 2010 and 2011.