RBS 2009 Annual Report Download - page 125
Download and view the complete annual report
Please find page 125 of the 2009 RBS annual report below. You can navigate through the pages in the report by either clicking on the pages listed below, or by using the keyword search tool below to find specific information within the annual report.-
 1
1 -
2
-
3
-
4
-
5
-
6
-
7
-
8
-
9
-
10
-
11
-
12
-
13
-
14
-
15
-
16
-
17
-
18
-
19
-
20
-
21
-
22
-
23
-
24
-
25
-
26
-
27
-
28
-
29
-
30
-
31
-
32
-
33
-
34
-
35
-
36
-
37
-
38
-
39
-
40
-
41
-
42
-
43
-
44
-
45
-
46
-
47
-
48
-
49
-
50
-
51
-
52
-
53
-
54
-
55
-
56
-
57
-
58
-
59
-
60
-
61
-
62
-
63
-
64
-
65
-
66
-
67
-
68
-
69
-
70
-
71
-
72
-
73
-
74
-
75
-
76
-
77
-
78
-
79
-
80
-
81
-
82
-
83
-
84
-
85
-
86
-
87
-
88
-
89
-
90
-
91
-
92
-
93
-
94
-
95
-
96
-
97
-
98
-
99
-
100
-
101
-
102
-
103
-
104
-
105
-
106
-
107
-
108
-
109
-
110
-
111
-
112
-
113
-
114
-
 115
115 -
 116
116 -
 117
117 -
 118
118 -
 119
119 -
 120
120 -
 121
121 -
 122
122 -
 123
123 -
 124
124 -
 125
125 -
 126
126 -
 127
127 -
 128
128 -
 129
129 -
 130
130 -
 131
131 -
 132
132 -
 133
133 -
 134
134 -
 135
135 -
136
-
137
-
138
-
139
-
140
-
141
-
142
-
143
-
144
-
145
-
146
-
147
-
148
-
149
-
150
-
151
-
152
-
153
-
154
-
155
-
156
-
157
-
158
-
159
-
160
-
161
-
162
-
163
-
164
-
165
-
166
-
167
-
168
-
169
-
170
-
171
-
172
-
173
-
174
-
175
-
176
-
177
-
178
-
179
-
180
-
181
-
182
-
183
-
184
-
185
-
186
-
187
-
188
-
189
-
190
-
191
-
192
-
193
-
194
-
195
-
196
-
197
-
198
-
199
-
200
-
201
-
202
-
203
-
204
-
205
-
206
-
207
-
208
-
209
-
210
-
211
-
212
-
213
-
214
-
215
-
216
-
217
-
218
-
219
-
220
-
221
-
222
-
223
-
224
-
225
-
226
-
227
-
228
-
229
-
230
-
231
-
232
-
233
-
234
-
235
-
236
-
237
-
238
-
239
-
240
-
241
-
242
-
243
-
244
-
245
-
246
-
247
-
248
-
249
-
250
-
251
-
252
-
253
-
254
-
255
-
256
-
257
-
258
-
259
-
260
-
261
-
262
-
263
-
264
-
265
-
266
-
267
-
268
-
269
-
270
-
271
-
272
-
273
-
274
-
275
-
276
-
277
-
278
-
279
-
280
-
281
-
282
-
283
-
284
-
285
-
286
-
287
-
288
-
289
-
290
-
291
-
292
-
293
-
294
-
295
-
296
-
297
-
298
-
299
-
300
-
301
-
302
-
303
-
304
-
305
-
306
-
307
-
308
-
309
-
310
-
311
-
312
-
313
-
314
-
315
-
316
-
317
-
318
-
319
-
320
-
321
-
322
-
323
-
324
-
325
-
326
-
327
-
328
-
329
-
330
-
331
-
332
-
333
-
334
-
335
-
336
-
337
-
338
-
339
-
340
-
341
-
342
-
343
-
344
-
345
-
346
-
347
-
348
-
349
-
350
-
351
-
352
-
353
-
354
-
355
-
356
-
357
-
358
-
359
-
360
-
361
-
362
-
363
-
364
-
365
-
366
-
367
-
368
-
369
-
370
-
371
-
372
-
373
-
374
-
375
-
376
-
377
-
378
-
379
-
380
-
381
-
382
-
383
-
384
-
385
-
386
-
387
-
388
-
389
-
390
 |
 |

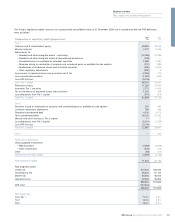
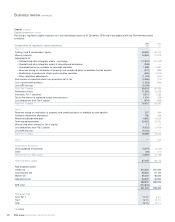
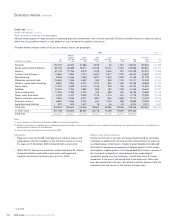
Business review
Risk, capital and liquidity management
The Group has seen a continuation of challenging financial market and
economic conditions during 2009. Although some signs of improvement
have started to emerge, the performance of key economies remains
uncertain and the Group has continued to experience material
impairment losses and credit market write-downs, including further
write-downs in respect of monoline exposures. The majority of these are
in the Non-Core division, which in time will be run down, significantly
reducing the size of the Group’s balance sheet and associated capital
requirements.
In April 2009, £5 billion of preference shares were redeemed and
replaced by ordinary shares using the proceeds of the Second Placing
and Open Offer. This strengthened the Group’s Core Tier 1 capital,
enhancing its financial stability during a tough economic and market
period.
As an interim measure pending full compliance with Basel 2, the Group,
with the agreement of the regulators, consolidates the RWAs of ABN
AMRO on the basis of Basel 1 plus an adjustment factor. The Group is
advanced in its preparation for moving to a Basel 2 compliant approach
for the ABN AMRO businesses it will retain. As part of this transition the
Group has agreed with the FSA to increase the adjustment factor with
effect from 31 December 2009 to reflect changing circumstances. This
change has increased RWAs by approximately £8 billion thereby
reducing the Core Tier 1 ratio at 31 December 2009 by 20 basis points.
Asset Protection Scheme
On 22 December 2009, the Group acceded to the Asset Protection
Scheme (‘APS’ or ‘the Scheme’). The key commercial terms and details
of the assets covered by the Scheme are set out on page 174.
Following the accession to the APS, HM Treasury provides loss
protection against potential losses arising in a pool of assets. HM
Treasury also subscribed to £25.5 billion of capital in the form of B
shares and a Dividend Access Share with a further £8 billion of capital
in the form of B shares, potentially available as contingent capital. The
Group pays annual fees in respect of the protection and contingent
capital. The Group has the option, subject to HM Treasury consent, to
pay the annual premium, contingent capital and the exit fee payable in
connection with any termination of the Group’s participation in the APS
in whole or in part, by waiving the entitlements of members of the
Group to certain UK tax reliefs.
Following accession to the APS, arrangements were put in place within
the Group that extended effective APS protection to all other regulated
entities holding assets covered by the APS.
On 19 January 2009, the FSA announced that it expects each bank
participating in the UK Government’s recapitalisation scheme to have a
minimum Core Tier 1 ratio of 4% on a stressed basis. As at 31
December 2009 the Group’s Core Tier 1 ratio was 11.0% (2008 – 6.6%).
While the RWA relief from the APS enabled the Group to maintain robust
capital ratios, it is clear that the next few years pose continuing
challenges in respect of impairment levels, trading performance and the
return to profitability, RWA volatility including procyclical effects, and
increasing regulatory demands.
The Group’s policy will be to continue to maintain a strong capital base,
to develop this base as appropriate and to utilise it efficiently throughout
the Group’s activities in order to optimise shareholder returns while
maintaining a prudent relationship between the capital base and the
underlying risks of the business.
The subscription for £25.5 billion of B shares improved the Group’s Core
Tier 1 capital ratio by 580 basis points at 31 December 2009.
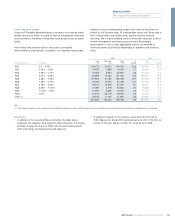
Regulatory capital impact of the APS
Methodology
The regulatory capital requirements for assets covered by the Scheme
are calculated using the securitisation framework under the FSA
prudential rules. The calculation is as follows (known as ‘the Uncapped
Amount’):
•First Loss – the residual first loss, after impairments and writedowns,
to date, is deducted from the available capital – split equally between
Core Tier 1 and Tier 2 capital;
•HM Treasury share of covered losses – after the first loss piece has
been deducted, the 90% of assets covered by HM Treasury are risk
weighted at 0%; and
•RBS share of covered losses – the remaining 10% share of loss is
borne by RBS and is risk weighted in the normal way.
Should the Uncapped Amount be higher than those of the underlying
assets (ignoring the Scheme), the capital requirements for the Scheme
are capped at the level of the requirements for the underlying assets
(‘Capped Amount’). Where capped, the Group apportions the Capped
Amount up to the level of the First Loss as calculated above; any
unused Capped Amount after the First Loss capital deduction will be
taken as RWAs for the Group’s share of covered losses.
Adjustments to the regulatory capital calculation can be made for either
currency or maturity mismatches. These occur where there is a
difference between the currency or maturity of the protection and that
of the underlying asset. These mismatches will have an impact upon the
timing of the removal of the cap and level of regulatory capital benefit
on the Uncapped Amount, but this effect is not material.
Impact at accession
The Group expects initially to calculate its capital requirements in
accordance with the Capped basis. Accordingly, the APS itself (viewed
separately from the B share issuance) at accession had no impact on
the Pillar 1 regulatory capital requirement in respect of the assets
covered by the APS. It will, however, improve the total capital ratios, and
the Core Tier 1 ratios, of the Group as a whole. It is also expected that
the protection afforded by the APS will assist the Group in satisfying the
forward looking stress testing framework applied by the FSA.
123RBS Group Annual Report and Accounts 2009