RBS 2009 Annual Report Download - page 132
Download and view the complete annual report
Please find page 132 of the 2009 RBS annual report below. You can navigate through the pages in the report by either clicking on the pages listed below, or by using the keyword search tool below to find specific information within the annual report.-
 1
1 -
2
-
3
-
4
-
5
-
6
-
7
-
8
-
9
-
10
-
11
-
12
-
13
-
14
-
15
-
16
-
17
-
18
-
19
-
20
-
21
-
22
-
23
-
24
-
25
-
26
-
27
-
28
-
29
-
30
-
31
-
32
-
33
-
34
-
35
-
36
-
37
-
38
-
39
-
40
-
41
-
42
-
43
-
44
-
45
-
46
-
47
-
48
-
49
-
50
-
51
-
52
-
53
-
54
-
55
-
56
-
57
-
58
-
59
-
60
-
61
-
62
-
63
-
64
-
65
-
66
-
67
-
68
-
69
-
70
-
71
-
72
-
73
-
74
-
75
-
76
-
77
-
78
-
79
-
80
-
81
-
82
-
83
-
84
-
85
-
86
-
87
-
88
-
89
-
90
-
91
-
92
-
93
-
94
-
95
-
96
-
97
-
98
-
99
-
100
-
101
-
102
-
103
-
104
-
105
-
106
-
107
-
108
-
109
-
110
-
111
-
112
-
113
-
114
-
115
-
116
-
117
-
118
-
119
-
120
-
121
-
 122
122 -
 123
123 -
 124
124 -
 125
125 -
 126
126 -
 127
127 -
 128
128 -
 129
129 -
 130
130 -
 131
131 -
 132
132 -
 133
133 -
 134
134 -
 135
135 -
 136
136 -
 137
137 -
 138
138 -
 139
139 -
 140
140 -
 141
141 -
 142
142 -
143
-
144
-
145
-
146
-
147
-
148
-
149
-
150
-
151
-
152
-
153
-
154
-
155
-
156
-
157
-
158
-
159
-
160
-
161
-
162
-
163
-
164
-
165
-
166
-
167
-
168
-
169
-
170
-
171
-
172
-
173
-
174
-
175
-
176
-
177
-
178
-
179
-
180
-
181
-
182
-
183
-
184
-
185
-
186
-
187
-
188
-
189
-
190
-
191
-
192
-
193
-
194
-
195
-
196
-
197
-
198
-
199
-
200
-
201
-
202
-
203
-
204
-
205
-
206
-
207
-
208
-
209
-
210
-
211
-
212
-
213
-
214
-
215
-
216
-
217
-
218
-
219
-
220
-
221
-
222
-
223
-
224
-
225
-
226
-
227
-
228
-
229
-
230
-
231
-
232
-
233
-
234
-
235
-
236
-
237
-
238
-
239
-
240
-
241
-
242
-
243
-
244
-
245
-
246
-
247
-
248
-
249
-
250
-
251
-
252
-
253
-
254
-
255
-
256
-
257
-
258
-
259
-
260
-
261
-
262
-
263
-
264
-
265
-
266
-
267
-
268
-
269
-
270
-
271
-
272
-
273
-
274
-
275
-
276
-
277
-
278
-
279
-
280
-
281
-
282
-
283
-
284
-
285
-
286
-
287
-
288
-
289
-
290
-
291
-
292
-
293
-
294
-
295
-
296
-
297
-
298
-
299
-
300
-
301
-
302
-
303
-
304
-
305
-
306
-
307
-
308
-
309
-
310
-
311
-
312
-
313
-
314
-
315
-
316
-
317
-
318
-
319
-
320
-
321
-
322
-
323
-
324
-
325
-
326
-
327
-
328
-
329
-
330
-
331
-
332
-
333
-
334
-
335
-
336
-
337
-
338
-
339
-
340
-
341
-
342
-
343
-
344
-
345
-
346
-
347
-
348
-
349
-
350
-
351
-
352
-
353
-
354
-
355
-
356
-
357
-
358
-
359
-
360
-
361
-
362
-
363
-
364
-
365
-
366
-
367
-
368
-
369
-
370
-
371
-
372
-
373
-
374
-
375
-
376
-
377
-
378
-
379
-
380
-
381
-
382
-
383
-
384
-
385
-
386
-
387
-
388
-
389
-
390
 |
 |

Business review continued
Credit risk continued
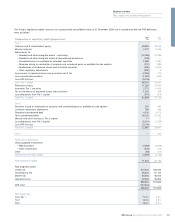
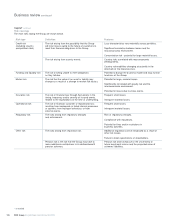
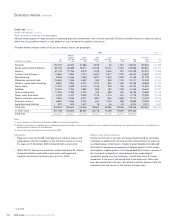
Credit risk assets*
Credit risk assets consist of loans and advances (including overdraft
facilities), instalment credit, finance lease receivables and traded
instruments across all customer types. Reverse repurchase agreements
and issuer risk (primarily debt securities – see page 151 are excluded.
Where relevant, and unless otherwise stated, data reflects the effect of
credit mitigation techniques. All the disclosures in this section (pages
130 to 141) are unaudited and are labelled with an asterisk (*).
RBS Group Annual Report and Accounts 2009130
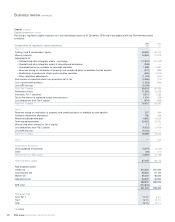
Key points
•Total credit risk assets reduced by £146 billion, or 17% during 2009
or 13% on a constant currency basis.
•Reductions occurred across industry sectors and in most regions.
The largest reductions were in lending balances and derivatives.
•As part of the strategic review, the designation of assets between
Core and Non-Core divisions was completed during the first
half of 2009, hence the portfolio is reported according to the
divisional structure as at 31 December 2009 in the table above.
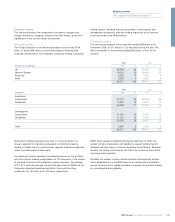
2009 2008(1)
Credit risk assets £m £m
UK Retail 103,029 97,069
UK Corporate 109,908 126,736
Wealth 15,951 17,604
Global Banking & Markets 224,355 450,321
Global Transaction Services 7,152 8,995
Ulster Bank 42,042 64,695
US Retail & Commercial 52,104 82,862
Other 2,981 6,594
Core(1) 557,522 n/a
Non-Core 151,264 n/a
708,786 854,876
Note:
(1) The 2008 analysis between Core and Non-Core is not available.
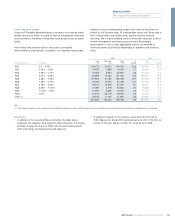
Credit concentration risk
The Group defines four key areas of concentration in credit risk that are
monitored, reported and managed at both Group and divisional levels.
These are single name, industry/sector, country and product/asset class.
Frameworks to address single name, industry/sector and country
concentrations are established and continue to be enhanced and
embedded into business processes across the Group. Aspects of the
product/asset class framework are in place whilst others will be
developed during the course of 2010.
Under the Group’s credit approval framework, the required approval
level is linked to the size of exposure with exposures above a certain
level requiring the highest level of approval, held by a very small
number of executives. In addition, the Group’s single name
concentration framework includes specific approval requirements;
additional reporting and monitoring; and the requirement to develop
plans to address and reduce excess exposures.
The Group has also developed a more robust approach and framework for
managing sector concentrations, a major outcome of which is the regular
review of the most material concentrations at the Executive Risk Forum
(ERF). These reviews include an assessment of the Group’s franchise in a
particular sector, an analysis of the outlook (including downside
outcomes), identification of key vulnerabilities and stress/scenario tests.
Reviews conclude with specific sector caps and other portfolio strategies
to align the Group’s exposure profile with its appetite.
Country risk
Country risk arises from sovereign events (for example, default or
restructuring); economic events (for example, contagion of sovereign
default to other parts of the economy, cyclical economic shock); political
events (for example, convertibility restrictions and expropriation or
nationalisation); and natural disaster or conflict. Losses are broadly
defined and include credit, market, liquidity, operational and franchise
risk related losses.
The Group’s appetite for country risk is set by the ERF in the form of
limits by country risk grade, with sub-limits on term exposure. Countries
where exposures exceed this limit framework are approved by the ERF
while authority is delegated to the Group Country Risk Committee
(GCRC) to manage exposures within the framework. Specific limits are
set for each country based on a risk assessment taking into account the
Group’s franchise and business mix in that country. Additional limitations
– on product types with higher loss potential, for example – are
established to address specific vulnerabilities in the context of a
country's outlook and/or the Group's business strategy in a particular
country. A country watch list framework is in place to proactively monitor
emerging issues and facilitate the development of mitigation strategies.
* unaudited