RBS 2009 Annual Report Download - page 74
Download and view the complete annual report
Please find page 74 of the 2009 RBS annual report below. You can navigate through the pages in the report by either clicking on the pages listed below, or by using the keyword search tool below to find specific information within the annual report.-
 1
1 -
2
-
3
-
4
-
5
-
6
-
7
-
8
-
9
-
10
-
11
-
12
-
13
-
14
-
15
-
16
-
17
-
18
-
19
-
20
-
21
-
22
-
23
-
24
-
25
-
26
-
27
-
28
-
29
-
30
-
31
-
32
-
33
-
34
-
35
-
36
-
37
-
38
-
39
-
40
-
41
-
42
-
43
-
44
-
45
-
46
-
47
-
48
-
49
-
50
-
51
-
52
-
53
-
54
-
55
-
56
-
57
-
58
-
59
-
60
-
61
-
62
-
63
-
 64
64 -
 65
65 -
 66
66 -
 67
67 -
 68
68 -
 69
69 -
 70
70 -
 71
71 -
 72
72 -
 73
73 -
 74
74 -
 75
75 -
 76
76 -
 77
77 -
 78
78 -
 79
79 -
 80
80 -
 81
81 -
 82
82 -
 83
83 -
 84
84 -
85
-
86
-
87
-
88
-
89
-
90
-
91
-
92
-
93
-
94
-
95
-
96
-
97
-
98
-
99
-
100
-
101
-
102
-
103
-
104
-
105
-
106
-
107
-
108
-
109
-
110
-
111
-
112
-
113
-
114
-
115
-
116
-
117
-
118
-
119
-
120
-
121
-
122
-
123
-
124
-
125
-
126
-
127
-
128
-
129
-
130
-
131
-
132
-
133
-
134
-
135
-
136
-
137
-
138
-
139
-
140
-
141
-
142
-
143
-
144
-
145
-
146
-
147
-
148
-
149
-
150
-
151
-
152
-
153
-
154
-
155
-
156
-
157
-
158
-
159
-
160
-
161
-
162
-
163
-
164
-
165
-
166
-
167
-
168
-
169
-
170
-
171
-
172
-
173
-
174
-
175
-
176
-
177
-
178
-
179
-
180
-
181
-
182
-
183
-
184
-
185
-
186
-
187
-
188
-
189
-
190
-
191
-
192
-
193
-
194
-
195
-
196
-
197
-
198
-
199
-
200
-
201
-
202
-
203
-
204
-
205
-
206
-
207
-
208
-
209
-
210
-
211
-
212
-
213
-
214
-
215
-
216
-
217
-
218
-
219
-
220
-
221
-
222
-
223
-
224
-
225
-
226
-
227
-
228
-
229
-
230
-
231
-
232
-
233
-
234
-
235
-
236
-
237
-
238
-
239
-
240
-
241
-
242
-
243
-
244
-
245
-
246
-
247
-
248
-
249
-
250
-
251
-
252
-
253
-
254
-
255
-
256
-
257
-
258
-
259
-
260
-
261
-
262
-
263
-
264
-
265
-
266
-
267
-
268
-
269
-
270
-
271
-
272
-
273
-
274
-
275
-
276
-
277
-
278
-
279
-
280
-
281
-
282
-
283
-
284
-
285
-
286
-
287
-
288
-
289
-
290
-
291
-
292
-
293
-
294
-
295
-
296
-
297
-
298
-
299
-
300
-
301
-
302
-
303
-
304
-
305
-
306
-
307
-
308
-
309
-
310
-
311
-
312
-
313
-
314
-
315
-
316
-
317
-
318
-
319
-
320
-
321
-
322
-
323
-
324
-
325
-
326
-
327
-
328
-
329
-
330
-
331
-
332
-
333
-
334
-
335
-
336
-
337
-
338
-
339
-
340
-
341
-
342
-
343
-
344
-
345
-
346
-
347
-
348
-
349
-
350
-
351
-
352
-
353
-
354
-
355
-
356
-
357
-
358
-
359
-
360
-
361
-
362
-
363
-
364
-
365
-
366
-
367
-
368
-
369
-
370
-
371
-
372
-
373
-
374
-
375
-
376
-
377
-
378
-
379
-
380
-
381
-
382
-
383
-
384
-
385
-
386
-
387
-
388
-
389
-
390
 |
 |

RBS Group Annual Report and Accounts 200972
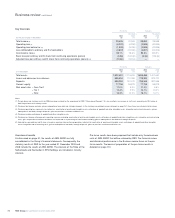
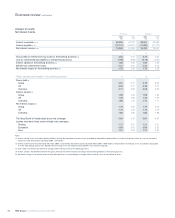
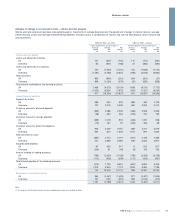
Key financials Pro forma Statutory
Restated (1) Restated (1)
2009 2008 2009 2008
for the year ended 31 December £m £m £m £m
Total income (2) 29,425 20,599 38,690 25,868
Operating loss (3) (6,232) (6,938) (2,595) (40,836)
Operating loss before tax (4) (1,928) (8,296) (2,595) (40,836)
Loss attributable to ordinary and B shareholders (3,607) (24,306) (3,607) (24,306)
Cost:income ratio (5) 59.1% 78.6% 55.5% 209.5%
Basic loss per ordinary and B share from continuing operations (pence) (6.3p) (146.2p) (6.3p) (146.2p)
Adjusted loss per ordinary and B share from continuing operations (pence) (6) (13.2p) (43.1p) ——
Pro forma Statutory
2009 2008 2009 2008
at 31 December £m £m £m £m
Total assets 1,522,481 2,218,693 1,696,486 2,401,652
Loans and advances to customers 595,694 731,265 728,393 874,722
Deposits 636,252 781,070 756,346 897,556
Owners’ equity 77,736 58,879 77,736 58,879
Risk asset ratio – Core Tier 1 11.0% 5.9% 11.0% 6.6%
– Tier 1 14.4% 9.9% 14.1% 10.0%
– Total 16.3% 14.2% 16.1% 14.1%
Notes:
(1) The pro forma and statutory results for 2008 have been restated for the amendment to IFRS 2 ‘Share-based Payment’. This has resulted in an increase in staff costs amounting to £169 million in
both the pro forma and statutory results.
(2) Pro forma total income excludes gain on redemption of own debt and strategic disposals. In the statutory consolidated income statement on page 241, these items are included in total income.
(3) Pro forma operating loss represents loss before tax, amortisation of purchased intangible assets, write-down of goodwill and other intangible assets, integration and restructuring costs, gain on
redemption of own debt, strategic disposals, gains on pensions curtailment and bonus tax.
(4) Pro forma excludes write-down of goodwill and other intangible assets.
(5) Pro forma cost:income ratio represents operating expenses excluding amortisation of purchased intangible assets, write-down of goodwill and other intangible assets, integration and restructuring
costs, gains on pensions curtailment and bonus tax expressed as a percentage of total income excluding gain on redemption of own debt and strategic disposals.
(6) Adjusted loss per ordinary and B share is based on earnings from continuing operations adjusted for amortisation of purchased intangible assets, write-down of goodwill and other intangible
assets, integration and restructuring costs, gain on redemption of own debt, strategic disposals, gains on pensions curtailment and bonus tax.
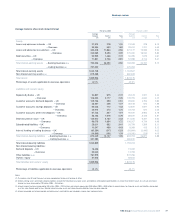
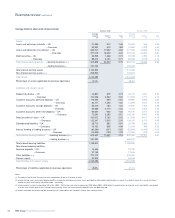
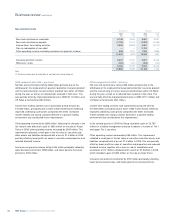
Overview of results
As discussed on page 51, the results of ABN AMRO are fully
consolidated in the Group’s financial statements. Consequently, the
statutory results of RBS for the year ended 31 December 2009 and
2008 include the results of ABN AMRO. The interests of the State of the
Netherlands and Santander in RFS Holdings are included in minority
interests.
Pro forma results have been prepared that include only those business
units of ABN AMRO that will be retained by RBS. The financial review
and divisional performance in the Business review focus on the pro
forma results. The basis of preparation of the pro forma results is
detailed on page 113.
Business review continued