RBS 2009 Annual Report Download - page 83
Download and view the complete annual report
Please find page 83 of the 2009 RBS annual report below. You can navigate through the pages in the report by either clicking on the pages listed below, or by using the keyword search tool below to find specific information within the annual report.-
 1
1 -
2
-
3
-
4
-
5
-
6
-
7
-
8
-
9
-
10
-
11
-
12
-
13
-
14
-
15
-
16
-
17
-
18
-
19
-
20
-
21
-
22
-
23
-
24
-
25
-
26
-
27
-
28
-
29
-
30
-
31
-
32
-
33
-
34
-
35
-
36
-
37
-
38
-
39
-
40
-
41
-
42
-
43
-
44
-
45
-
46
-
47
-
48
-
49
-
50
-
51
-
52
-
53
-
54
-
55
-
56
-
57
-
58
-
59
-
60
-
61
-
62
-
63
-
64
-
65
-
66
-
67
-
68
-
69
-
70
-
71
-
72
-
 73
73 -
 74
74 -
 75
75 -
 76
76 -
 77
77 -
 78
78 -
 79
79 -
 80
80 -
 81
81 -
 82
82 -
 83
83 -
 84
84 -
 85
85 -
 86
86 -
 87
87 -
 88
88 -
 89
89 -
 90
90 -
 91
91 -
 92
92 -
 93
93 -
94
-
95
-
96
-
97
-
98
-
99
-
100
-
101
-
102
-
103
-
104
-
105
-
106
-
107
-
108
-
109
-
110
-
111
-
112
-
113
-
114
-
115
-
116
-
117
-
118
-
119
-
120
-
121
-
122
-
123
-
124
-
125
-
126
-
127
-
128
-
129
-
130
-
131
-
132
-
133
-
134
-
135
-
136
-
137
-
138
-
139
-
140
-
141
-
142
-
143
-
144
-
145
-
146
-
147
-
148
-
149
-
150
-
151
-
152
-
153
-
154
-
155
-
156
-
157
-
158
-
159
-
160
-
161
-
162
-
163
-
164
-
165
-
166
-
167
-
168
-
169
-
170
-
171
-
172
-
173
-
174
-
175
-
176
-
177
-
178
-
179
-
180
-
181
-
182
-
183
-
184
-
185
-
186
-
187
-
188
-
189
-
190
-
191
-
192
-
193
-
194
-
195
-
196
-
197
-
198
-
199
-
200
-
201
-
202
-
203
-
204
-
205
-
206
-
207
-
208
-
209
-
210
-
211
-
212
-
213
-
214
-
215
-
216
-
217
-
218
-
219
-
220
-
221
-
222
-
223
-
224
-
225
-
226
-
227
-
228
-
229
-
230
-
231
-
232
-
233
-
234
-
235
-
236
-
237
-
238
-
239
-
240
-
241
-
242
-
243
-
244
-
245
-
246
-
247
-
248
-
249
-
250
-
251
-
252
-
253
-
254
-
255
-
256
-
257
-
258
-
259
-
260
-
261
-
262
-
263
-
264
-
265
-
266
-
267
-
268
-
269
-
270
-
271
-
272
-
273
-
274
-
275
-
276
-
277
-
278
-
279
-
280
-
281
-
282
-
283
-
284
-
285
-
286
-
287
-
288
-
289
-
290
-
291
-
292
-
293
-
294
-
295
-
296
-
297
-
298
-
299
-
300
-
301
-
302
-
303
-
304
-
305
-
306
-
307
-
308
-
309
-
310
-
311
-
312
-
313
-
314
-
315
-
316
-
317
-
318
-
319
-
320
-
321
-
322
-
323
-
324
-
325
-
326
-
327
-
328
-
329
-
330
-
331
-
332
-
333
-
334
-
335
-
336
-
337
-
338
-
339
-
340
-
341
-
342
-
343
-
344
-
345
-
346
-
347
-
348
-
349
-
350
-
351
-
352
-
353
-
354
-
355
-
356
-
357
-
358
-
359
-
360
-
361
-
362
-
363
-
364
-
365
-
366
-
367
-
368
-
369
-
370
-
371
-
372
-
373
-
374
-
375
-
376
-
377
-
378
-
379
-
380
-
381
-
382
-
383
-
384
-
385
-
386
-
387
-
388
-
389
-
390
 |
 |

81RBS Group Annual Report and Accounts 2009
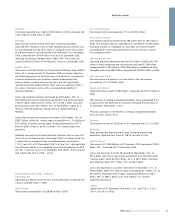
2009 compared with 2008 – pro forma
Staff costs were up £1,091 million with most of the movement relating to
adverse movements in foreign exchange rates and some salary inflation.
Changes in incentive compensation, primarily in Global Banking &
Markets, represented most of the remaining change.
Premises and equipment costs rose by £369 million due to the impact
of expanded Group premises in London and the US.
Other expenses fell by £288 million due to integration benefits in GBM
partially offset by increased deposit insurance levies in the US.
2009 compared with 2008 – statutory
Staff costs, excluding pension schemes curtailment gains, were
up £1,373 million with most of the movement relating to adverse
movements in foreign exchange rates and some salary inflation.
Changes in incentive compensation, primarily in Global Banking &
Markets, represented most of the remaining change.
Pension curtailment gains of £2,148 million were recognised in 2009
arising from changes to prospective pension benefits in the defined
benefit scheme and certain other subsidiary schemes.
Premises and equipment costs rose by £494 million primarily due to the
impact of expanded Group premises in London and the US.
Other expenses fell by £120 million due to integration benefits in GBM
partially offset by increased deposit insurance levies in the US.
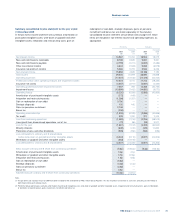
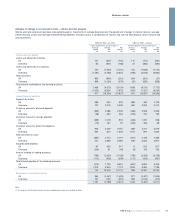
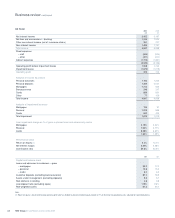
Operating expenses Pro forma (1) Statutory
Restated (2) Restated (2)
2009 2008 2009 2008
£m £m £m £m
Administrative expenses:
Staff costs
– excluding gains on pensions curtailment 9,081 7,990 11,783 10,410
– gains on pensions curtailment ——(2,148) —
Premises and equipment 2,468 2,099 3,087 2,593
Other administrative expenses 3,979 4,267 5,584 5,464
Total administrative expenses 15,528 14,356 18,306 18,467
Depreciation and amortisation 1,873 1,832 2,809 3,154
Write-down of goodwill and other intangible assets — —363 32,581
17,401 16,188 21,478 54,202
Note:
(1) Pro forma excludes amortisation of purchased intangible assets, write-down of goodwill and other intangible assets, integration and restructuring costs, gains on pensions curtailment and bonus tax.
(2) The pro forma and statutory results for 2008 have been restated for the amendment to IFRS 2 ‘Share-based Payment’. This has resulted in an increase in staff costs amounting to £169 million in
both the pro forma and statutory results.
Business review