RBS 2009 Annual Report Download - page 151
Download and view the complete annual report
Please find page 151 of the 2009 RBS annual report below. You can navigate through the pages in the report by either clicking on the pages listed below, or by using the keyword search tool below to find specific information within the annual report.-
 1
1 -
2
-
3
-
4
-
5
-
6
-
7
-
8
-
9
-
10
-
11
-
12
-
13
-
14
-
15
-
16
-
17
-
18
-
19
-
20
-
21
-
22
-
23
-
24
-
25
-
26
-
27
-
28
-
29
-
30
-
31
-
32
-
33
-
34
-
35
-
36
-
37
-
38
-
39
-
40
-
41
-
42
-
43
-
44
-
45
-
46
-
47
-
48
-
49
-
50
-
51
-
52
-
53
-
54
-
55
-
56
-
57
-
58
-
59
-
60
-
61
-
62
-
63
-
64
-
65
-
66
-
67
-
68
-
69
-
70
-
71
-
72
-
73
-
74
-
75
-
76
-
77
-
78
-
79
-
80
-
81
-
82
-
83
-
84
-
85
-
86
-
87
-
88
-
89
-
90
-
91
-
92
-
93
-
94
-
95
-
96
-
97
-
98
-
99
-
100
-
101
-
102
-
103
-
104
-
105
-
106
-
107
-
108
-
109
-
110
-
111
-
112
-
113
-
114
-
115
-
116
-
117
-
118
-
119
-
120
-
121
-
122
-
123
-
124
-
125
-
126
-
127
-
128
-
129
-
130
-
131
-
132
-
133
-
134
-
135
-
136
-
137
-
138
-
139
-
140
-
 141
141 -
 142
142 -
 143
143 -
 144
144 -
 145
145 -
 146
146 -
 147
147 -
 148
148 -
 149
149 -
 150
150 -
 151
151 -
 152
152 -
 153
153 -
 154
154 -
 155
155 -
 156
156 -
 157
157 -
 158
158 -
 159
159 -
 160
160 -
 161
161 -
162
-
163
-
164
-
165
-
166
-
167
-
168
-
169
-
170
-
171
-
172
-
173
-
174
-
175
-
176
-
177
-
178
-
179
-
180
-
181
-
182
-
183
-
184
-
185
-
186
-
187
-
188
-
189
-
190
-
191
-
192
-
193
-
194
-
195
-
196
-
197
-
198
-
199
-
200
-
201
-
202
-
203
-
204
-
205
-
206
-
207
-
208
-
209
-
210
-
211
-
212
-
213
-
214
-
215
-
216
-
217
-
218
-
219
-
220
-
221
-
222
-
223
-
224
-
225
-
226
-
227
-
228
-
229
-
230
-
231
-
232
-
233
-
234
-
235
-
236
-
237
-
238
-
239
-
240
-
241
-
242
-
243
-
244
-
245
-
246
-
247
-
248
-
249
-
250
-
251
-
252
-
253
-
254
-
255
-
256
-
257
-
258
-
259
-
260
-
261
-
262
-
263
-
264
-
265
-
266
-
267
-
268
-
269
-
270
-
271
-
272
-
273
-
274
-
275
-
276
-
277
-
278
-
279
-
280
-
281
-
282
-
283
-
284
-
285
-
286
-
287
-
288
-
289
-
290
-
291
-
292
-
293
-
294
-
295
-
296
-
297
-
298
-
299
-
300
-
301
-
302
-
303
-
304
-
305
-
306
-
307
-
308
-
309
-
310
-
311
-
312
-
313
-
314
-
315
-
316
-
317
-
318
-
319
-
320
-
321
-
322
-
323
-
324
-
325
-
326
-
327
-
328
-
329
-
330
-
331
-
332
-
333
-
334
-
335
-
336
-
337
-
338
-
339
-
340
-
341
-
342
-
343
-
344
-
345
-
346
-
347
-
348
-
349
-
350
-
351
-
352
-
353
-
354
-
355
-
356
-
357
-
358
-
359
-
360
-
361
-
362
-
363
-
364
-
365
-
366
-
367
-
368
-
369
-
370
-
371
-
372
-
373
-
374
-
375
-
376
-
377
-
378
-
379
-
380
-
381
-
382
-
383
-
384
-
385
-
386
-
387
-
388
-
389
-
390
 |
 |

Business review
Risk, capital and liquidity management
149RBS Group Annual Report and Accounts 2009
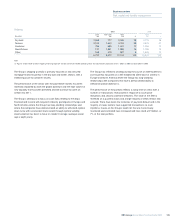
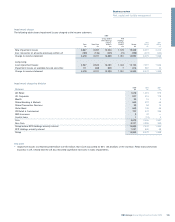
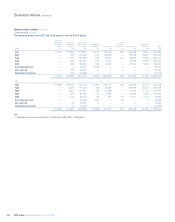
Balance sheet analysis
All the disclosures in this section (pages 149 to 153) are audited.
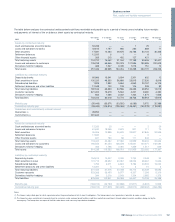
The following tables provide an analysis of the credit quality and
distribution of financial assets by the Group’s internal credit quality
gradings, geography and industry sector. Credit risk assets analysed on
the preceding pages are reported internally to senior management,
however they exclude certain exposures and take account of netting
agreements including master netting arrangements that provide a right
of legal set-off but do not meet the criteria for off-set in IFRS. The
analysis below is therefore provided to supplement the credit risk assets
analysis and to reconcile to the consolidated balance sheet.
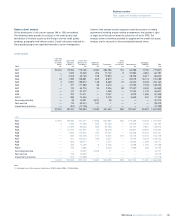
Credit quality
Cash and
balances Loans and Loans and Other
at central advances advances to Settlement financial Contingent
banks to banks (1) customers balances Derivatives instruments Commitments liabilities Total
2009 £m £m £m £m £m £m £m £m £m
AQ1 52,234 79,453 115,738 6,592 390,786 754 62,488 9,792 717,837
AQ2 — 1,873 14,025 306 11,740 9 27,984 4,854 60,791
AQ3 1 2,206 36,165 199 10,903 — 28,749 6,417 84,640
AQ4 23 1,455 128,981 605 8,872 — 53,979 16,174 210,089
AQ5 2 2,851 159,914 149 8,639 37 44,342 8,228 224,162
AQ6 1 471 111,588 49 2,674 — 31,235 2,736 148,754
AQ7 — 122 64,724 26 2,326 98 27,057 2,605 96,958
AQ8 — 172 31,272 — 1,448 — 12,730 1,179 46,801
AQ9 — 237 21,411 — 2,007 — 5,379 1,465 30,499
AQ10 — 386 10,460 — 2,019 — 3,698 570 17,133
Accruing past due — 36 16,331 3,910 39 — — — 20,316
Non-accrual — 115 34,910 197 1 — — — 35,223
Impairment provision — (157) (17,126) —————(17,283)
52,261 89,220 728,393 12,033 441,454 898 297,641 55,020 1,675,920
2008
AQ1 12,397 98,082 157,212 11,958 837,987 630 123,399 10,279 1,251,944
AQ2 3 7,250 21,656 535 27,225 — 23,379 2,132 82,180
AQ3 — 14,296 68,663 550 35,756 — 26,797 2,851 148,913
AQ4 — 12,792 141,857 34 46,318 — 64,891 13,800 279,692
AQ5 — 1,066 175,544 252 27,047 — 64,308 19,124 287,341
AQ6 — 680 124,606 217 6,632 222 18,145 12,246 162,748
AQ7 — 201 107,624 248 4,547 — 17,915 8,208 138,743
AQ8 — 305 28,517 — 1,477 — 14,603 1,269 46,171
AQ9 — 356 17,329 9 2,136 — 6,298 1,160 27,288
AQ10 — 279 7,586 — 3,423 — 1,989 468 13,745
Accruing past due — — 15,667 4,029 11 — — — 19,707
Non-accrual — 129 19,350 — — — — — 19,479
Impairment provision — (127) (10,889) — — — — — (11,016)
12,400 135,309 874,722 17,832 992,559 852 361,724 71,537 2,466,935
Note:
(1) Excluding items in the course of collection of £2,533 million (2008 – £2,888 million).