RBS 2009 Annual Report Download - page 293
Download and view the complete annual report
Please find page 293 of the 2009 RBS annual report below. You can navigate through the pages in the report by either clicking on the pages listed below, or by using the keyword search tool below to find specific information within the annual report.-
 1
1 -
2
-
3
-
4
-
5
-
6
-
7
-
8
-
9
-
10
-
11
-
12
-
13
-
14
-
15
-
16
-
17
-
18
-
19
-
20
-
21
-
22
-
23
-
24
-
25
-
26
-
27
-
28
-
29
-
30
-
31
-
32
-
33
-
34
-
35
-
36
-
37
-
38
-
39
-
40
-
41
-
42
-
43
-
44
-
45
-
46
-
47
-
48
-
49
-
50
-
51
-
52
-
53
-
54
-
55
-
56
-
57
-
58
-
59
-
60
-
61
-
62
-
63
-
64
-
65
-
66
-
67
-
68
-
69
-
70
-
71
-
72
-
73
-
74
-
75
-
76
-
77
-
78
-
79
-
80
-
81
-
82
-
83
-
84
-
85
-
86
-
87
-
88
-
89
-
90
-
91
-
92
-
93
-
94
-
95
-
96
-
97
-
98
-
99
-
100
-
101
-
102
-
103
-
104
-
105
-
106
-
107
-
108
-
109
-
110
-
111
-
112
-
113
-
114
-
115
-
116
-
117
-
118
-
119
-
120
-
121
-
122
-
123
-
124
-
125
-
126
-
127
-
128
-
129
-
130
-
131
-
132
-
133
-
134
-
135
-
136
-
137
-
138
-
139
-
140
-
141
-
142
-
143
-
144
-
145
-
146
-
147
-
148
-
149
-
150
-
151
-
152
-
153
-
154
-
155
-
156
-
157
-
158
-
159
-
160
-
161
-
162
-
163
-
164
-
165
-
166
-
167
-
168
-
169
-
170
-
171
-
172
-
173
-
174
-
175
-
176
-
177
-
178
-
179
-
180
-
181
-
182
-
183
-
184
-
185
-
186
-
187
-
188
-
189
-
190
-
191
-
192
-
193
-
194
-
195
-
196
-
197
-
198
-
199
-
200
-
201
-
202
-
203
-
204
-
205
-
206
-
207
-
208
-
209
-
210
-
211
-
212
-
213
-
214
-
215
-
216
-
217
-
218
-
219
-
220
-
221
-
222
-
223
-
224
-
225
-
226
-
227
-
228
-
229
-
230
-
231
-
232
-
233
-
234
-
235
-
236
-
237
-
238
-
239
-
240
-
241
-
242
-
243
-
244
-
245
-
246
-
247
-
248
-
249
-
250
-
251
-
252
-
253
-
254
-
255
-
256
-
257
-
258
-
259
-
260
-
261
-
262
-
263
-
264
-
265
-
266
-
267
-
268
-
269
-
270
-
271
-
272
-
273
-
274
-
275
-
276
-
277
-
278
-
279
-
280
-
281
-
282
-
 283
283 -
 284
284 -
 285
285 -
 286
286 -
 287
287 -
 288
288 -
 289
289 -
 290
290 -
 291
291 -
 292
292 -
 293
293 -
 294
294 -
 295
295 -
 296
296 -
 297
297 -
 298
298 -
 299
299 -
 300
300 -
 301
301 -
 302
302 -
 303
303 -
304
-
305
-
306
-
307
-
308
-
309
-
310
-
311
-
312
-
313
-
314
-
315
-
316
-
317
-
318
-
319
-
320
-
321
-
322
-
323
-
324
-
325
-
326
-
327
-
328
-
329
-
330
-
331
-
332
-
333
-
334
-
335
-
336
-
337
-
338
-
339
-
340
-
341
-
342
-
343
-
344
-
345
-
346
-
347
-
348
-
349
-
350
-
351
-
352
-
353
-
354
-
355
-
356
-
357
-
358
-
359
-
360
-
361
-
362
-
363
-
364
-
365
-
366
-
367
-
368
-
369
-
370
-
371
-
372
-
373
-
374
-
375
-
376
-
377
-
378
-
379
-
380
-
381
-
382
-
383
-
384
-
385
-
386
-
387
-
388
-
389
-
390
 |
 |

Financial statements
Notes on the accounts
291RBS Group Annual Report and Accounts 2009
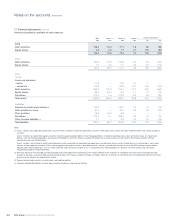
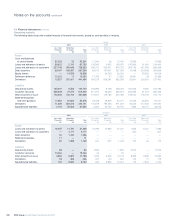
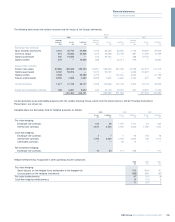
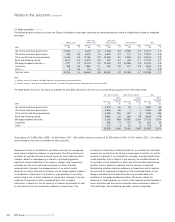
The following tables show, by contractual maturity, the undiscounted cash flows payable up to a period of 20 years from the balance sheet date,
including future payments of interest.
On balance sheet liabilities Group
0-3 months 3-12 months 1-3 years 3-5 years 5-10 years 10-20 years
2009 £m £m £m £m £m £m
Deposits by banks 65,966 15,541 3,934 2,301 632 12
Customer accounts 521,400 15,619 5,944 4,221 8,490 4,392
Debt securities in issue 100,220 49,300 56,869 25,915 27,326 3,819
Derivatives held for hedging 660 1,566 3,232 1,264 1,674 1,508
Subordinated liabilities 1,929 1,892 3,654 4,963 20,157 6,105
Settlement balances and other liabilities 12,048 100 139 104 239 83
702,223 84,018 73,772 38,768 58,518 15,919
Guarantees and commitments – notional amount
Guarantees (1) 39,952 —————
Commitments (2) 291,634 —————
331,586 —————
2008
Deposits by banks 154,614 14,347 3,345 2,754 2,048 34
Customer accounts 523,268 33,450 6,577 6,337 7,298 5,319
Debt securities in issue 131,714 48,652 40,067 38,223 38,667 5,626
Derivatives held for hedging 394 2,216 2,543 1,334 2,682 1,373
Subordinated liabilities 1,753 4,271 6,824 5,793 24,503 13,030
Settlement balances and other liabilities 13,351 5 12 6 10 6
825,094 102,941 59,368 54,447 75,208 25,388
Notes:
(1) The Group is only called upon to satisfy a guarantee when the guaranteed party fails to meet its obligations. The Group expects most guarantees it provides to expire unused.
(2) The Group has given commitments to provide funds to customers under undrawn formal facilities, credit lines and other commitments to lend subject to certain conditions being met by the
counterparty. The Group does not expect all facilities to be drawn, and some may lapse before drawdown.
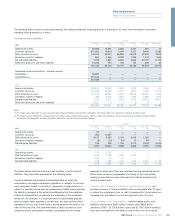
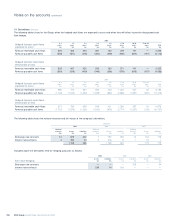
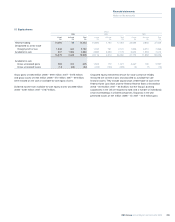
Company
0-3 months 3-12 months 1-3 years 3-5 years 5-10 years 10-20 years
2009 £m £m £m £m £m £m
Deposits by banks 93 —————
Customer accounts 964 12,337 ————
Debt securities in issue 3,132 2,080 2,732 3,615 1,255 —
Derivatives held for hedging (5) (23) (19) 13 64 —
Subordinated liabilities 106 406 1,146 2,010 2,634 3,923
4,290 14,800 3,859 5,638 3,953 3,923
2008
Deposits by banks 116 1,707 ————
Debt securities in issue 4,448 3,105 1,334 6,105 — —
Derivatives held for hedging 186 16 30 1 — —
Subordinated liabilities 158 458 1,464 1,376 4,241 5,149
4,908 5,286 2,828 7,482 4,241 5,149
The tables above show the timing of cash outflows to settle financial
liabilities. They have been prepared on the following basis:
Financial liabilities are included at the earliest date on which the
counterparty can require repayment regardless of whether or not such
early repayment results in a penalty. If repayment is triggered by, or is
subject to, specific criteria such as market price hurdles being reached,
the liability is included at the earliest possible date that the conditions
could be fulfilled without considering the probability of the conditions
being met. For example, if a structured note is automatically prepaid
when an equity index exceeds a certain level, the cash outflow will be
included in the less than three months’ period whatever the level of the
index at the year end. The settlement date of debt securities in issue
issued by certain securitisation vehicles consolidated by the Group
depends on when cash flows are received from the securitised assets.
Where these assets are prepayable, the timing of the cash outflow
relating to securities assumes that each asset will be prepaid at the
earliest possible date.
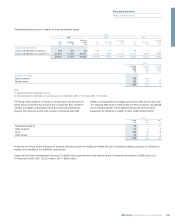
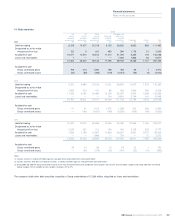
Liabilities with a contractual maturity of greater than 20 years – the
principal amounts of financial liabilities that are repayable after 20 years
or where the counterparty has no right to repayment of the principal are
excluded from the table as are interest payments after 20 years.
Held-for-trading assets and liabilities – held-for-trading assets and
liabilities amounting to £650.5 billion (assets) and £568.5 billion
(liabilities) (2008 – £1,226.8 billion assets and £1,146.7 billion liabilities)
have been excluded from the table in view of their short term nature.