RBS 2009 Annual Report Download - page 320
Download and view the complete annual report
Please find page 320 of the 2009 RBS annual report below. You can navigate through the pages in the report by either clicking on the pages listed below, or by using the keyword search tool below to find specific information within the annual report.-
 1
1 -
2
-
3
-
4
-
5
-
6
-
7
-
8
-
9
-
10
-
11
-
12
-
13
-
14
-
15
-
16
-
17
-
18
-
19
-
20
-
21
-
22
-
23
-
24
-
25
-
26
-
27
-
28
-
29
-
30
-
31
-
32
-
33
-
34
-
35
-
36
-
37
-
38
-
39
-
40
-
41
-
42
-
43
-
44
-
45
-
46
-
47
-
48
-
49
-
50
-
51
-
52
-
53
-
54
-
55
-
56
-
57
-
58
-
59
-
60
-
61
-
62
-
63
-
64
-
65
-
66
-
67
-
68
-
69
-
70
-
71
-
72
-
73
-
74
-
75
-
76
-
77
-
78
-
79
-
80
-
81
-
82
-
83
-
84
-
85
-
86
-
87
-
88
-
89
-
90
-
91
-
92
-
93
-
94
-
95
-
96
-
97
-
98
-
99
-
100
-
101
-
102
-
103
-
104
-
105
-
106
-
107
-
108
-
109
-
110
-
111
-
112
-
113
-
114
-
115
-
116
-
117
-
118
-
119
-
120
-
121
-
122
-
123
-
124
-
125
-
126
-
127
-
128
-
129
-
130
-
131
-
132
-
133
-
134
-
135
-
136
-
137
-
138
-
139
-
140
-
141
-
142
-
143
-
144
-
145
-
146
-
147
-
148
-
149
-
150
-
151
-
152
-
153
-
154
-
155
-
156
-
157
-
158
-
159
-
160
-
161
-
162
-
163
-
164
-
165
-
166
-
167
-
168
-
169
-
170
-
171
-
172
-
173
-
174
-
175
-
176
-
177
-
178
-
179
-
180
-
181
-
182
-
183
-
184
-
185
-
186
-
187
-
188
-
189
-
190
-
191
-
192
-
193
-
194
-
195
-
196
-
197
-
198
-
199
-
200
-
201
-
202
-
203
-
204
-
205
-
206
-
207
-
208
-
209
-
210
-
211
-
212
-
213
-
214
-
215
-
216
-
217
-
218
-
219
-
220
-
221
-
222
-
223
-
224
-
225
-
226
-
227
-
228
-
229
-
230
-
231
-
232
-
233
-
234
-
235
-
236
-
237
-
238
-
239
-
240
-
241
-
242
-
243
-
244
-
245
-
246
-
247
-
248
-
249
-
250
-
251
-
252
-
253
-
254
-
255
-
256
-
257
-
258
-
259
-
260
-
261
-
262
-
263
-
264
-
265
-
266
-
267
-
268
-
269
-
270
-
271
-
272
-
273
-
274
-
275
-
276
-
277
-
278
-
279
-
280
-
281
-
282
-
283
-
284
-
285
-
286
-
287
-
288
-
289
-
290
-
291
-
292
-
293
-
294
-
295
-
296
-
297
-
298
-
299
-
300
-
301
-
302
-
303
-
304
-
305
-
306
-
307
-
308
-
309
-
 310
310 -
 311
311 -
 312
312 -
 313
313 -
 314
314 -
 315
315 -
 316
316 -
 317
317 -
 318
318 -
 319
319 -
 320
320 -
 321
321 -
 322
322 -
 323
323 -
 324
324 -
 325
325 -
 326
326 -
 327
327 -
 328
328 -
 329
329 -
 330
330 -
331
-
332
-
333
-
334
-
335
-
336
-
337
-
338
-
339
-
340
-
341
-
342
-
343
-
344
-
345
-
346
-
347
-
348
-
349
-
350
-
351
-
352
-
353
-
354
-
355
-
356
-
357
-
358
-
359
-
360
-
361
-
362
-
363
-
364
-
365
-
366
-
367
-
368
-
369
-
370
-
371
-
372
-
373
-
374
-
375
-
376
-
377
-
378
-
379
-
380
-
381
-
382
-
383
-
384
-
385
-
386
-
387
-
388
-
389
-
390
 |
 |

RBS Group Annual Report and Accounts 2009318
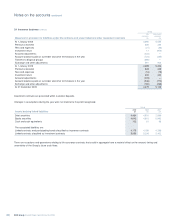
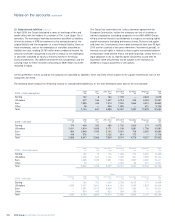
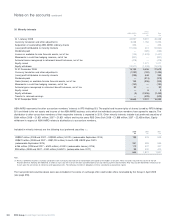
Notes on the accounts continued
Certain preference shares issued by the company are classified as liabilities; these securities remain subject to the capital maintenance rules of the
Companies Act 2006.
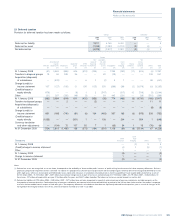
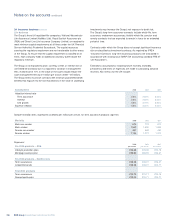
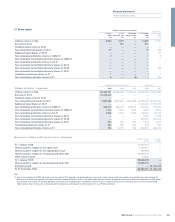
The following tables analyse the remaining maturity of subordinated liabilities by (1) the final redemption date; and (2) the next call date.
Group
2010 2011 2012-2014 2015-2019 Thereafter Perpetual Total
2009 – final redemption £m £m £m £m £m £m £m
Sterling 122 8 164 1,778 — 2,603 4,675
US dollars 407 196 1,457 5,314 323 5,294 12,991
Euro 1,589 443 1,414 7,360 1,664 4,410 16,880
Other 26 — 554 1,905 — 621 3,106
Total 2,144 647 3,589 16,357 1,987 12,928 37,652
Group
Currently 2010 2011 2012-2014 2015-2019 Thereafter Perpetual Total
2009 – call date £m £m £m £m £m £m £m £m
Sterling 174 408 202 496 1,720 1,504 171 4,675
US dollars 1,811 1,814 1,429 3,171 1,139 1,891 1,736 12,991
Euro 564 2,849 1,755 3,142 5,501 709 2,360 16,880
Other 419 576 — 1,025 914 172 — 3,106
Total 2,968 5,647 3,386 7,834 9,274 4,276 4,267 37,652
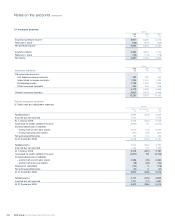
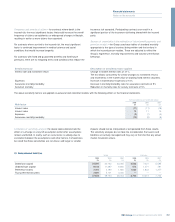
Group
2009 2010 2011-2013 2014-2018 Thereafter Perpetual Total
2008 – final redemption £m £m £m £m £m £m £m
Sterling 192 15 176 1,458 370 6,287 8,498
US dollars 1,308 342 1,123 7,435 561 7,655 18,424
Euro 1,865 1,378 1,991 7,923 1,957 4,087 19,201
Other 29 — 7 2,284 34 677 3,031
Total 3,394 1,735 3,297 19,100 2,922 18,706 49,154
Group
Currently 2009 2010 2011-2013 2014-2018 Thereafter Perpetual Total
2008 – call date £m £m £m £m £m £m £m £m
Sterling — 192 752 1,039 2,729 3,615 171 8,498
US dollars 1,833 3,247 2,601 4,814 1,951 2,053 1,925 18,424
Euro — 2,351 3,137 5,699 7,021 942 51 19,201
Other — 500 405 922 954 250 — 3,031
Total 1,833 6,290 6,895 12,474 12,655 6,860 2,147 49,154
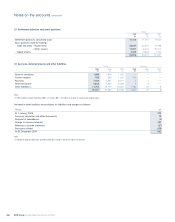
25 Subordinated liabilities continued
In April 2009, the Group concluded a series of exchange offers and
tender offers with the holders of a number of Tier 1 and Upper Tier 2
securities. The exchanges involving instruments classified as liabilities
all met the criteria in IFRS for treatment as the extinguishment of the
original liability and the recognition of a new financial liability. Gains on
these exchanges, and on the redemption of securities classified as
liabilities for cash, totalling £3,790 million were credited to income. No
amounts have been recognised in income in relation to the redemption
of securities classified as equity or minority interest in the Group
financial statements. The difference between the consideration and the
carrying value for these securities amounting to £829 million has been
recorded in equity.
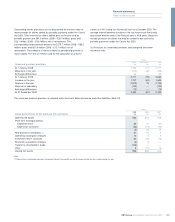
The Group has undertaken that, unless otherwise agreed with the
European Commission, neither the company nor any of its direct or
indirect subsidiaries (excluding companies in the ABN AMRO Group)
will pay external investors any dividends or coupons on existing hybrid
capital instruments (including preference shares, B shares and upper
and lower tier 2 instruments) from a date starting not later than 30 April
2010 and for a period of two years thereafter ("the deferral period"), or
exercise any call rights in relation to these capital instruments between
24 November 2009 and the end of the deferral period, unless there is a
legal obligation to do so. Hybrid capital instruments issued after 24
November 2009 will generally not be subject to the restriction on
dividend or coupon payments or call options.