RBS 2009 Annual Report Download - page 124
Download and view the complete annual report
Please find page 124 of the 2009 RBS annual report below. You can navigate through the pages in the report by either clicking on the pages listed below, or by using the keyword search tool below to find specific information within the annual report.-
 1
1 -
2
-
3
-
4
-
5
-
6
-
7
-
8
-
9
-
10
-
11
-
12
-
13
-
14
-
15
-
16
-
17
-
18
-
19
-
20
-
21
-
22
-
23
-
24
-
25
-
26
-
27
-
28
-
29
-
30
-
31
-
32
-
33
-
34
-
35
-
36
-
37
-
38
-
39
-
40
-
41
-
42
-
43
-
44
-
45
-
46
-
47
-
48
-
49
-
50
-
51
-
52
-
53
-
54
-
55
-
56
-
57
-
58
-
59
-
60
-
61
-
62
-
63
-
64
-
65
-
66
-
67
-
68
-
69
-
70
-
71
-
72
-
73
-
74
-
75
-
76
-
77
-
78
-
79
-
80
-
81
-
82
-
83
-
84
-
85
-
86
-
87
-
88
-
89
-
90
-
91
-
92
-
93
-
94
-
95
-
96
-
97
-
98
-
99
-
100
-
101
-
102
-
103
-
104
-
105
-
106
-
107
-
108
-
109
-
110
-
111
-
112
-
113
-
 114
114 -
 115
115 -
 116
116 -
 117
117 -
 118
118 -
 119
119 -
 120
120 -
 121
121 -
 122
122 -
 123
123 -
 124
124 -
 125
125 -
 126
126 -
 127
127 -
 128
128 -
 129
129 -
 130
130 -
 131
131 -
 132
132 -
 133
133 -
 134
134 -
135
-
136
-
137
-
138
-
139
-
140
-
141
-
142
-
143
-
144
-
145
-
146
-
147
-
148
-
149
-
150
-
151
-
152
-
153
-
154
-
155
-
156
-
157
-
158
-
159
-
160
-
161
-
162
-
163
-
164
-
165
-
166
-
167
-
168
-
169
-
170
-
171
-
172
-
173
-
174
-
175
-
176
-
177
-
178
-
179
-
180
-
181
-
182
-
183
-
184
-
185
-
186
-
187
-
188
-
189
-
190
-
191
-
192
-
193
-
194
-
195
-
196
-
197
-
198
-
199
-
200
-
201
-
202
-
203
-
204
-
205
-
206
-
207
-
208
-
209
-
210
-
211
-
212
-
213
-
214
-
215
-
216
-
217
-
218
-
219
-
220
-
221
-
222
-
223
-
224
-
225
-
226
-
227
-
228
-
229
-
230
-
231
-
232
-
233
-
234
-
235
-
236
-
237
-
238
-
239
-
240
-
241
-
242
-
243
-
244
-
245
-
246
-
247
-
248
-
249
-
250
-
251
-
252
-
253
-
254
-
255
-
256
-
257
-
258
-
259
-
260
-
261
-
262
-
263
-
264
-
265
-
266
-
267
-
268
-
269
-
270
-
271
-
272
-
273
-
274
-
275
-
276
-
277
-
278
-
279
-
280
-
281
-
282
-
283
-
284
-
285
-
286
-
287
-
288
-
289
-
290
-
291
-
292
-
293
-
294
-
295
-
296
-
297
-
298
-
299
-
300
-
301
-
302
-
303
-
304
-
305
-
306
-
307
-
308
-
309
-
310
-
311
-
312
-
313
-
314
-
315
-
316
-
317
-
318
-
319
-
320
-
321
-
322
-
323
-
324
-
325
-
326
-
327
-
328
-
329
-
330
-
331
-
332
-
333
-
334
-
335
-
336
-
337
-
338
-
339
-
340
-
341
-
342
-
343
-
344
-
345
-
346
-
347
-
348
-
349
-
350
-
351
-
352
-
353
-
354
-
355
-
356
-
357
-
358
-
359
-
360
-
361
-
362
-
363
-
364
-
365
-
366
-
367
-
368
-
369
-
370
-
371
-
372
-
373
-
374
-
375
-
376
-
377
-
378
-
379
-
380
-
381
-
382
-
383
-
384
-
385
-
386
-
387
-
388
-
389
-
390
 |
 |

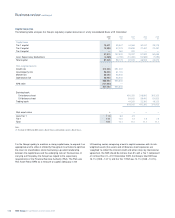
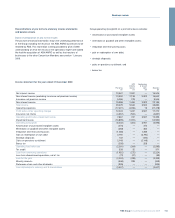
Business review continued
Capital* continued
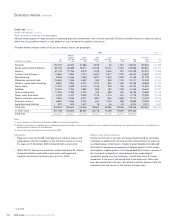
Capital resources continued
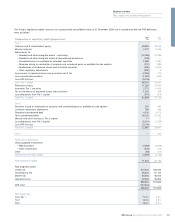
The Group’s regulatory capital resources on a full consolidation basis at 31 December 2009 and in accordance with the FSA definitions were
as follows:
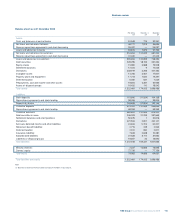
2009 2008
Composition of regulatory capital (statutory) £m £m
Tier 1
Ordinary and B shareholders' equity 69,890 45,525
Minority interests 16,895 21,619
Adjustments for:
– Goodwill and other intangible assets – continuing (17,847) (20,049)
– Goodwill and other intangible assets of discontinued businesses (238) —
– Unrealised losses on available-for-sale debt securities 1,888 3,687
– Reserves arising on revaluation of property and unrealised gains on available-for-sale equities (207) (984)
– Reallocation of preference shares and innovative securities (656) (1,813)
– Other regulatory adjustments (1,184) (362)
Less excess of expected losses over provisions net of tax (2,558) (770)
Less securitisation positions (1,353) (663)
Less APS first loss (5,106) —
Core Tier 1 capital 59,524 46,190
Preference shares 11,265 16,655
Innovative Tier 1 securities 5,213 7,383
Tax on the excess of expected losses over provisions 1,020 308
Less deductions from Tier 1 capital (601) (689)
Total Tier 1 capital 76,421 69,847
Tier 2
Reserves arising on revaluation of property and unrealised gains on available-for-sale equities 207 984
Collective impairment allowances 796 666
Perpetual subordinated debt 4,950 9,829
Term subordinated debt 20,063 23,162
Minority and other interests in Tier 2 capital 11 11
Less deductions from Tier 2 capital (5,532) (2,429)
Less APS first loss (5,106) —
Total Tier 2 capital 15,389 32,223
Tier 3 —260
Supervisory deductions
Unconsolidated investments (4,472) (4,044)
Other (93) (111)
Deductions from total capital (4,565) (4,155)
Total regulatory capital 87,245 98,175
Risk-weighted assets
Credit risk 513,200 551,300
Counterparty risk 56,500 61,100
Market risk 65,000 46,500
Operational risk 33,900 36,900
668,600 695,800
APS relief (127,600) —
541,000 695,800
Risk asset ratio
Core Tier 1 11.0% 6.6%
Tier 1 14.1% 10.0%
Total 16.1% 14.1%
RBS Group Annual Report and Accounts 2009122
* unaudited