RBS 2009 Annual Report Download - page 163
Download and view the complete annual report
Please find page 163 of the 2009 RBS annual report below. You can navigate through the pages in the report by either clicking on the pages listed below, or by using the keyword search tool below to find specific information within the annual report.-
 1
1 -
2
-
3
-
4
-
5
-
6
-
7
-
8
-
9
-
10
-
11
-
12
-
13
-
14
-
15
-
16
-
17
-
18
-
19
-
20
-
21
-
22
-
23
-
24
-
25
-
26
-
27
-
28
-
29
-
30
-
31
-
32
-
33
-
34
-
35
-
36
-
37
-
38
-
39
-
40
-
41
-
42
-
43
-
44
-
45
-
46
-
47
-
48
-
49
-
50
-
51
-
52
-
53
-
54
-
55
-
56
-
57
-
58
-
59
-
60
-
61
-
62
-
63
-
64
-
65
-
66
-
67
-
68
-
69
-
70
-
71
-
72
-
73
-
74
-
75
-
76
-
77
-
78
-
79
-
80
-
81
-
82
-
83
-
84
-
85
-
86
-
87
-
88
-
89
-
90
-
91
-
92
-
93
-
94
-
95
-
96
-
97
-
98
-
99
-
100
-
101
-
102
-
103
-
104
-
105
-
106
-
107
-
108
-
109
-
110
-
111
-
112
-
113
-
114
-
115
-
116
-
117
-
118
-
119
-
120
-
121
-
122
-
123
-
124
-
125
-
126
-
127
-
128
-
129
-
130
-
131
-
132
-
133
-
134
-
135
-
136
-
137
-
138
-
139
-
140
-
141
-
142
-
143
-
144
-
145
-
146
-
147
-
148
-
149
-
150
-
151
-
152
-
 153
153 -
 154
154 -
 155
155 -
 156
156 -
 157
157 -
 158
158 -
 159
159 -
 160
160 -
 161
161 -
 162
162 -
 163
163 -
 164
164 -
 165
165 -
 166
166 -
 167
167 -
 168
168 -
 169
169 -
 170
170 -
 171
171 -
 172
172 -
 173
173 -
174
-
175
-
176
-
177
-
178
-
179
-
180
-
181
-
182
-
183
-
184
-
185
-
186
-
187
-
188
-
189
-
190
-
191
-
192
-
193
-
194
-
195
-
196
-
197
-
198
-
199
-
200
-
201
-
202
-
203
-
204
-
205
-
206
-
207
-
208
-
209
-
210
-
211
-
212
-
213
-
214
-
215
-
216
-
217
-
218
-
219
-
220
-
221
-
222
-
223
-
224
-
225
-
226
-
227
-
228
-
229
-
230
-
231
-
232
-
233
-
234
-
235
-
236
-
237
-
238
-
239
-
240
-
241
-
242
-
243
-
244
-
245
-
246
-
247
-
248
-
249
-
250
-
251
-
252
-
253
-
254
-
255
-
256
-
257
-
258
-
259
-
260
-
261
-
262
-
263
-
264
-
265
-
266
-
267
-
268
-
269
-
270
-
271
-
272
-
273
-
274
-
275
-
276
-
277
-
278
-
279
-
280
-
281
-
282
-
283
-
284
-
285
-
286
-
287
-
288
-
289
-
290
-
291
-
292
-
293
-
294
-
295
-
296
-
297
-
298
-
299
-
300
-
301
-
302
-
303
-
304
-
305
-
306
-
307
-
308
-
309
-
310
-
311
-
312
-
313
-
314
-
315
-
316
-
317
-
318
-
319
-
320
-
321
-
322
-
323
-
324
-
325
-
326
-
327
-
328
-
329
-
330
-
331
-
332
-
333
-
334
-
335
-
336
-
337
-
338
-
339
-
340
-
341
-
342
-
343
-
344
-
345
-
346
-
347
-
348
-
349
-
350
-
351
-
352
-
353
-
354
-
355
-
356
-
357
-
358
-
359
-
360
-
361
-
362
-
363
-
364
-
365
-
366
-
367
-
368
-
369
-
370
-
371
-
372
-
373
-
374
-
375
-
376
-
377
-
378
-
379
-
380
-
381
-
382
-
383
-
384
-
385
-
386
-
387
-
388
-
389
-
390
 |
 |

Business review
Risk, capital and liquidity management
161RBS Group Annual Report and Accounts 2009
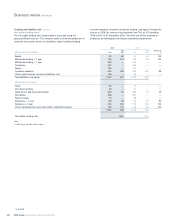
Market risk
All the disclosures in this section (pages 161 to 166) are audited unless
indicated otherwise with an asterisk (*).
Market risk arises from changes in interest rates, foreign currency, credit
spread, equity prices and risk related factors such as market volatilities.
The Group manages market risk centrally within its trading and non-
trading portfolios through a comprehensive market risk management
framework. This framework includes limits based on, but not limited to
VaR, scenario analysis, position and sensitivity analyses.
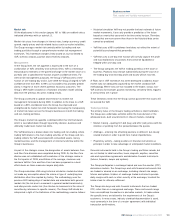
Measurement
At the Group level, the risk appetite is expressed in the form of a
combination of VaR, sensitivity and scenario limits. VaR is a technique
that produces estimates of the potential change in the market value of a
portfolio over a specified time horizon at given confidence levels. For
internal risk management purposes, the Group’s VaR assumes a time
horizon of one trading day and in June 2009 the Group changed its VaR
confidence level from 95% to 99% as it considers this provides greater
clarity in respect of more severe potential economic outcomes. The
Group’s VAR model is based on a historical simulation model utilising
data from the previous two years trading results.
The Group continued to update and enhance its market risk
management framework during 2009. In addition to the move to a VaR
based on a 99% confidence level, the Group has improved and
strengthened its market risk limit framework increasing the transparency
of market risk taken across the Group’s businesses in both the trading
and non-trading portfolios.
The Group’s market risk appetite is defined within this limit framework
which is cascaded down through legal entity, division, business and
ultimately trader level market risk limits.
The VaR disclosure is broken down into trading and non-trading, where
trading VaR relates to the main trading activities of the Group and non-
trading reflects the VaR associated with reclassified assets, money
market business and the management of internal funds flow within the
Group’s businesses.
As part of the strategic review, the designation of assets between Core
and Non-Core divisions was completed during 2009. As the Non-Core
division was not established until conclusion of the strategic review in
the first quarter of 2009, constitution of the average, maximum and
minimum VaR for Core and Non-Core has been prepared on a best
efforts basis as these measures require daily data.
The Group calculates VaR using historical simulation models but does
not make any assumption about the nature or type of underlying loss
distribution other than implied by history. The methodology uses the
previous 500 trading days of market data and calculates both general
market risk (the risk due to movement in general market benchmarks)
and idiosyncratic market risk (the risk due to movements in the value of
securities by reference to specific issuers). The Group VaR should be
interpreted in light of the limitations of the methodology used as follows:
•Historical simulation VaR may not provide the best estimate of future
market movements. It can only provide a prediction of the future
based on events that occurred in the time series horizon. Therefore,
events that are more severe than those in the historical data series
cannot be predicted;
•VaR that uses a 99% confidence level does not reflect the extent of
potential losses beyond that percentile;
•VaR that uses a one-day time horizon will not fully capture the profit
and loss implications of positions that cannot be liquidated or
hedged within one day; and
•The Group computes the VaR of trading portfolios at the close of
business. Positions may change substantially during the course of
the trading day and intra-day profit and losses will be incurred.
A ‘Risks not in VaR’ framework has been developed to address those
market risks not adequately captured by the market standard VaR
methodology. Where risks are not included in the model, various non-
VaR controls (for example, position monitoring, sensitivity limits, triggers
or stress limits) are in place.
These limitations mean that the Group cannot guarantee that losses will
not exceed the VaR.
Traded portfolios
The primary focus of the Group’s trading activities is client facilitation.
The Group also undertakes activities within the Core division of the
wholesale bank, built around clients in chosen markets, including:
•Market making – quoting firm bid (buy) and offer (sell) prices with the
intention of profiting from the spread between the quotes.
•Arbitrage – entering into offsetting positions in different, but closely
related markets in order to profit from market imperfections.
•Proprietary activity – taking positions in financial instruments as
principal in order to take advantage of anticipated market conditions.
Financial instruments held in the Group’s trading portfolios include, but
are not limited to: debt securities, loans, deposits, equities, securities
sale and repurchase agreements and derivative financial instruments
(futures, forwards, swaps and options).
The Group participates in exchange traded and over-the-counter (OTC)
derivatives markets. The Group buys and sells financial instruments that
are traded or cleared on an exchange, including interest rate swaps,
futures and options. Holders of exchange traded instruments provide
daily margins with cash or other security at the exchange, to which the
holders look for ultimate settlement.
The Group also buys and sells financial instruments that are traded
OTC, rather than on a recognised exchange. These instruments range
from commoditised transactions in derivative markets, to trades where
the specific terms are tailored to the requirements of the Group’s
customers. In many cases, industry standard documentation is used,
most commonly in the form of a master agreement, with individual
transaction confirmations.