RBS 2009 Annual Report Download - page 299
Download and view the complete annual report
Please find page 299 of the 2009 RBS annual report below. You can navigate through the pages in the report by either clicking on the pages listed below, or by using the keyword search tool below to find specific information within the annual report.-
 1
1 -
2
-
3
-
4
-
5
-
6
-
7
-
8
-
9
-
10
-
11
-
12
-
13
-
14
-
15
-
16
-
17
-
18
-
19
-
20
-
21
-
22
-
23
-
24
-
25
-
26
-
27
-
28
-
29
-
30
-
31
-
32
-
33
-
34
-
35
-
36
-
37
-
38
-
39
-
40
-
41
-
42
-
43
-
44
-
45
-
46
-
47
-
48
-
49
-
50
-
51
-
52
-
53
-
54
-
55
-
56
-
57
-
58
-
59
-
60
-
61
-
62
-
63
-
64
-
65
-
66
-
67
-
68
-
69
-
70
-
71
-
72
-
73
-
74
-
75
-
76
-
77
-
78
-
79
-
80
-
81
-
82
-
83
-
84
-
85
-
86
-
87
-
88
-
89
-
90
-
91
-
92
-
93
-
94
-
95
-
96
-
97
-
98
-
99
-
100
-
101
-
102
-
103
-
104
-
105
-
106
-
107
-
108
-
109
-
110
-
111
-
112
-
113
-
114
-
115
-
116
-
117
-
118
-
119
-
120
-
121
-
122
-
123
-
124
-
125
-
126
-
127
-
128
-
129
-
130
-
131
-
132
-
133
-
134
-
135
-
136
-
137
-
138
-
139
-
140
-
141
-
142
-
143
-
144
-
145
-
146
-
147
-
148
-
149
-
150
-
151
-
152
-
153
-
154
-
155
-
156
-
157
-
158
-
159
-
160
-
161
-
162
-
163
-
164
-
165
-
166
-
167
-
168
-
169
-
170
-
171
-
172
-
173
-
174
-
175
-
176
-
177
-
178
-
179
-
180
-
181
-
182
-
183
-
184
-
185
-
186
-
187
-
188
-
189
-
190
-
191
-
192
-
193
-
194
-
195
-
196
-
197
-
198
-
199
-
200
-
201
-
202
-
203
-
204
-
205
-
206
-
207
-
208
-
209
-
210
-
211
-
212
-
213
-
214
-
215
-
216
-
217
-
218
-
219
-
220
-
221
-
222
-
223
-
224
-
225
-
226
-
227
-
228
-
229
-
230
-
231
-
232
-
233
-
234
-
235
-
236
-
237
-
238
-
239
-
240
-
241
-
242
-
243
-
244
-
245
-
246
-
247
-
248
-
249
-
250
-
251
-
252
-
253
-
254
-
255
-
256
-
257
-
258
-
259
-
260
-
261
-
262
-
263
-
264
-
265
-
266
-
267
-
268
-
269
-
270
-
271
-
272
-
273
-
274
-
275
-
276
-
277
-
278
-
279
-
280
-
281
-
282
-
283
-
284
-
285
-
286
-
287
-
288
-
 289
289 -
 290
290 -
 291
291 -
 292
292 -
 293
293 -
 294
294 -
 295
295 -
 296
296 -
 297
297 -
 298
298 -
 299
299 -
 300
300 -
 301
301 -
 302
302 -
 303
303 -
 304
304 -
 305
305 -
 306
306 -
 307
307 -
 308
308 -
 309
309 -
310
-
311
-
312
-
313
-
314
-
315
-
316
-
317
-
318
-
319
-
320
-
321
-
322
-
323
-
324
-
325
-
326
-
327
-
328
-
329
-
330
-
331
-
332
-
333
-
334
-
335
-
336
-
337
-
338
-
339
-
340
-
341
-
342
-
343
-
344
-
345
-
346
-
347
-
348
-
349
-
350
-
351
-
352
-
353
-
354
-
355
-
356
-
357
-
358
-
359
-
360
-
361
-
362
-
363
-
364
-
365
-
366
-
367
-
368
-
369
-
370
-
371
-
372
-
373
-
374
-
375
-
376
-
377
-
378
-
379
-
380
-
381
-
382
-
383
-
384
-
385
-
386
-
387
-
388
-
389
-
390
 |
 |

Financial statements
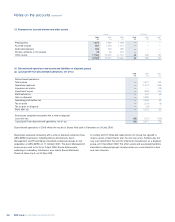
Notes on the accounts
297RBS Group Annual Report and Accounts 2009
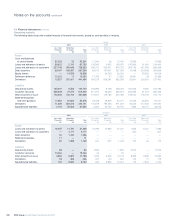
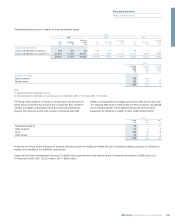
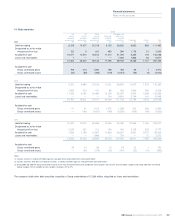
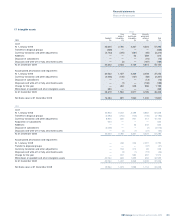
14 Debt securities Group
UK US Other Mortgage and
central central central Bank and other asset
and local and local and local building backed
government government government society securities(1) Corporate Other(2) Total
2009 £m £m £m £m £m £m £m £m
Held-for-trading 8,128 10,427 50,219 6,103 28,820 6,892 893 111,482
Designated as at fair value
through profit or loss 122 3 402 483 394 1,178 21 2,603
Available-for-sale 19,071 12,972 45,512 11,210 51,044 3,365 124 143,298
Loans and receivables 1 — — — 7,924 1,853 93 9,871
27,322 23,402 96,133 17,796 88,182 13,288 1,131 267,254
Available-for-sale
Gross unrealised gains 109 213 1,062 148 783 90 7 2,412
Gross unrealised losses (60) (89) (266) (119) (3,314) (56) (6) (3,910)
2008
Held-for-trading 5,372 9,859 37,519 11,021 39,879 11,057 1,573 116,280
Designated as at fair value
through profit or loss 2,085 510 472 89 236 1,580 456 5,428
Available-for-sale 11,330 6,152 32,480 13,139 62,067 5,400 2,288 132,856
Loans and receivables — — — 114 8,961 3,749 161 12,985
18,787 16,521 70,471 24,363 111,143 21,786 4,478 267,549
Available-for-sale
Gross unrealised gains 41 41 1,104 1,372 1,238 332 266 4,394
Gross unrealised losses — (166) (3,457) (168) (3,533) (426) (80) (7,830)
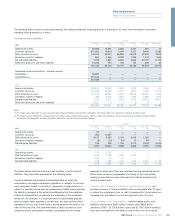
2007
Held-for-trading 10,370 12,670 60,356 16,234 62,430 27,365 1,246 190,671
Designated as at fair value
through profit or loss 2,235 397 101 154 340 2,125 425 5,777
Available-for-sale 1,030 2,169 31,597 11,835 36,607 6,551 5,747 95,536
Loans and receivables — — 1,896 — 704 — 72 2,672
13,635 15,236 93,950 28,223 100,081 36,041 7,490 294,656
Available-for-sale
Gross unrealised gains 29 14 56 12 18 22 1 152
Gross unrealised losses — (62) (276) (42) (181) (22) (10) (593)
Notes:
(1) Includes securities issued by US federal agencies and government sponsored entities and covered bonds.
(2) Includes securities, other than asset-backed securities, issued by US federal agencies and government sponsored entities.
(3) During 2009 and 2008 the Group reclassified financial assets from the held-for-trading and available-for-sale categories into the loans and receivables category and during 2008 from the held-for-
trading category into the available-for-sale category (see pages 275 to 277).
The company holds other debt securities issued by a Group undertaking of £1,286 million, classified as loans and receivables.