RBS 2009 Annual Report Download - page 36
Download and view the complete annual report
Please find page 36 of the 2009 RBS annual report below. You can navigate through the pages in the report by either clicking on the pages listed below, or by using the keyword search tool below to find specific information within the annual report.-
 1
1 -
2
-
3
-
4
-
5
-
6
-
7
-
8
-
9
-
10
-
11
-
12
-
13
-
14
-
15
-
16
-
17
-
18
-
19
-
20
-
21
-
22
-
23
-
24
-
25
-
 26
26 -
 27
27 -
 28
28 -
 29
29 -
 30
30 -
 31
31 -
 32
32 -
 33
33 -
 34
34 -
 35
35 -
 36
36 -
 37
37 -
 38
38 -
 39
39 -
 40
40 -
 41
41 -
 42
42 -
 43
43 -
 44
44 -
 45
45 -
 46
46 -
47
-
48
-
49
-
50
-
51
-
52
-
53
-
54
-
55
-
56
-
57
-
58
-
59
-
60
-
61
-
62
-
63
-
64
-
65
-
66
-
67
-
68
-
69
-
70
-
71
-
72
-
73
-
74
-
75
-
76
-
77
-
78
-
79
-
80
-
81
-
82
-
83
-
84
-
85
-
86
-
87
-
88
-
89
-
90
-
91
-
92
-
93
-
94
-
95
-
96
-
97
-
98
-
99
-
100
-
101
-
102
-
103
-
104
-
105
-
106
-
107
-
108
-
109
-
110
-
111
-
112
-
113
-
114
-
115
-
116
-
117
-
118
-
119
-
120
-
121
-
122
-
123
-
124
-
125
-
126
-
127
-
128
-
129
-
130
-
131
-
132
-
133
-
134
-
135
-
136
-
137
-
138
-
139
-
140
-
141
-
142
-
143
-
144
-
145
-
146
-
147
-
148
-
149
-
150
-
151
-
152
-
153
-
154
-
155
-
156
-
157
-
158
-
159
-
160
-
161
-
162
-
163
-
164
-
165
-
166
-
167
-
168
-
169
-
170
-
171
-
172
-
173
-
174
-
175
-
176
-
177
-
178
-
179
-
180
-
181
-
182
-
183
-
184
-
185
-
186
-
187
-
188
-
189
-
190
-
191
-
192
-
193
-
194
-
195
-
196
-
197
-
198
-
199
-
200
-
201
-
202
-
203
-
204
-
205
-
206
-
207
-
208
-
209
-
210
-
211
-
212
-
213
-
214
-
215
-
216
-
217
-
218
-
219
-
220
-
221
-
222
-
223
-
224
-
225
-
226
-
227
-
228
-
229
-
230
-
231
-
232
-
233
-
234
-
235
-
236
-
237
-
238
-
239
-
240
-
241
-
242
-
243
-
244
-
245
-
246
-
247
-
248
-
249
-
250
-
251
-
252
-
253
-
254
-
255
-
256
-
257
-
258
-
259
-
260
-
261
-
262
-
263
-
264
-
265
-
266
-
267
-
268
-
269
-
270
-
271
-
272
-
273
-
274
-
275
-
276
-
277
-
278
-
279
-
280
-
281
-
282
-
283
-
284
-
285
-
286
-
287
-
288
-
289
-
290
-
291
-
292
-
293
-
294
-
295
-
296
-
297
-
298
-
299
-
300
-
301
-
302
-
303
-
304
-
305
-
306
-
307
-
308
-
309
-
310
-
311
-
312
-
313
-
314
-
315
-
316
-
317
-
318
-
319
-
320
-
321
-
322
-
323
-
324
-
325
-
326
-
327
-
328
-
329
-
330
-
331
-
332
-
333
-
334
-
335
-
336
-
337
-
338
-
339
-
340
-
341
-
342
-
343
-
344
-
345
-
346
-
347
-
348
-
349
-
350
-
351
-
352
-
353
-
354
-
355
-
356
-
357
-
358
-
359
-
360
-
361
-
362
-
363
-
364
-
365
-
366
-
367
-
368
-
369
-
370
-
371
-
372
-
373
-
374
-
375
-
376
-
377
-
378
-
379
-
380
-
381
-
382
-
383
-
384
-
385
-
386
-
387
-
388
-
389
-
390
 |
 |

RBS Group Annual Report and Accounts 200934
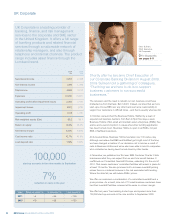
US Retail & Commercial
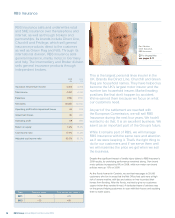
Ellen Alemany
Chief Executive,
Citizens and Head of
Americas
MFor biographies
see pages 8-11
Our aim is to earn our customers’ loyalty
and serve as their primary banking partner,
providing local, helpful service and global
resources. We will be a top-tier leader in our
markets, consistently perform for our
shareholders and invest in our colleagues and
the community. If we achieve this, we’ll become
a leading super-regional bank.
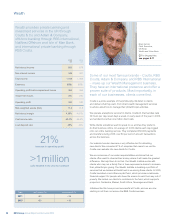
We started this job during 2009 and embarked on a plan that takes us
to our goal by 2013. But we also had to deal with weaknesses from our
past, as well as the effects on us and our customers of the most acute
recession. We took some very significant steps to bolster Citizens
Financial Group’s capital by converting $1.730 billion of subordinated
debt and $1.585 billion of preferred equity into common equity, which
when combined with lower risk-weighted assets, increased our Tier 1
risk-based capital to 11.62% from 9.15% at December 2008.
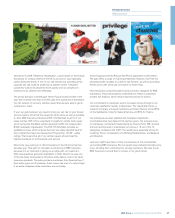
If we’re to become a top super-regional bank, we need to focus on our
core businesses. That’s why we exited all activities in Indiana, selling 65
branches to Old National Bank. We also identified several business lines
across the United States and designated them as non-core. They include
our Marine/RV business, our Dealer Finance business and portions of
our Auto Lending business. By isolating non-core activities that don’t fit
with our long-term plans, we are able to focus our investments in
infrastructure, technology and marketing to achieve leading positions in
the markets in which we choose to compete.
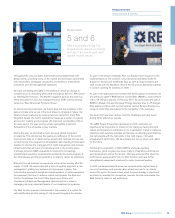
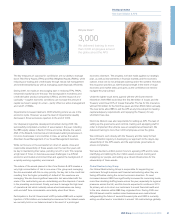
During 2009, we achieved Top 20 status in retail mortgage lending and
Top Five in auto finance among bank lenders to prime customers. We
also launched the TruFit Student Loan on 1 July. We designed this new
private student loan product to fill the gap after students exhaust their
federal student loan eligibility.
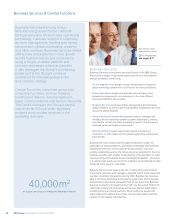
Our Commercial Banking market penetration increased, with lead
bank share of business increasing from 6% to 7% in the $5 million to
$25 million business segment and from 6% to 8% in the Middle Market
and Specialized Lending segment, for companies with $25 million to
$500 million in annual sales.
Target Return on equity (%) Cost:income (%) Loan:deposit (%)
2011 c.10 <70 <90
2013 >15 <55 <90
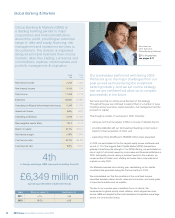
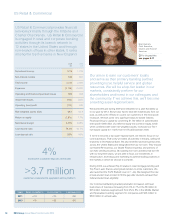
US Retail & Commercial provides financial
services primarily through the Citizens and
Charter One brands. US Retail & Commercial
is engaged in retail and corporate banking
activities through its branch network in
12 states in the United States and through
non-branch offices in other states. It ranks
among the top five banks in New England.
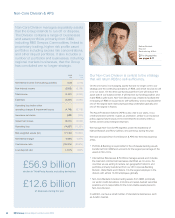
2009 2008
£m £m
Net interest income 1,775 1,726
Non-interest income 949 861
Total income 2,724 2,587
Expenses (2,135) (1,622)
Operating profit before impairment losses 589 965
Impairment losses (702) (437)
Operating (loss)/profit (113) 528
Risk-weighted assets (£bn) 59.7 63.9
Return on equity (1.8%) 7.7%
Net interest margin 2.37% 2.68%
Cost:income ratio 78.3% 62.7%
Loan:deposit ratio 80% 96%
4%
increase in customer deposits in the year
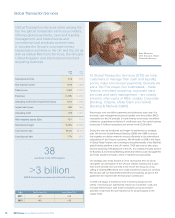
>3.7 million
customers converted to upgraded online platform