RBS 2009 Annual Report Download - page 140
Download and view the complete annual report
Please find page 140 of the 2009 RBS annual report below. You can navigate through the pages in the report by either clicking on the pages listed below, or by using the keyword search tool below to find specific information within the annual report.-
 1
1 -
2
-
3
-
4
-
5
-
6
-
7
-
8
-
9
-
10
-
11
-
12
-
13
-
14
-
15
-
16
-
17
-
18
-
19
-
20
-
21
-
22
-
23
-
24
-
25
-
26
-
27
-
28
-
29
-
30
-
31
-
32
-
33
-
34
-
35
-
36
-
37
-
38
-
39
-
40
-
41
-
42
-
43
-
44
-
45
-
46
-
47
-
48
-
49
-
50
-
51
-
52
-
53
-
54
-
55
-
56
-
57
-
58
-
59
-
60
-
61
-
62
-
63
-
64
-
65
-
66
-
67
-
68
-
69
-
70
-
71
-
72
-
73
-
74
-
75
-
76
-
77
-
78
-
79
-
80
-
81
-
82
-
83
-
84
-
85
-
86
-
87
-
88
-
89
-
90
-
91
-
92
-
93
-
94
-
95
-
96
-
97
-
98
-
99
-
100
-
101
-
102
-
103
-
104
-
105
-
106
-
107
-
108
-
109
-
110
-
111
-
112
-
113
-
114
-
115
-
116
-
117
-
118
-
119
-
120
-
121
-
122
-
123
-
124
-
125
-
126
-
127
-
128
-
129
-
 130
130 -
 131
131 -
 132
132 -
 133
133 -
 134
134 -
 135
135 -
 136
136 -
 137
137 -
 138
138 -
 139
139 -
 140
140 -
 141
141 -
 142
142 -
 143
143 -
 144
144 -
 145
145 -
 146
146 -
 147
147 -
 148
148 -
 149
149 -
 150
150 -
151
-
152
-
153
-
154
-
155
-
156
-
157
-
158
-
159
-
160
-
161
-
162
-
163
-
164
-
165
-
166
-
167
-
168
-
169
-
170
-
171
-
172
-
173
-
174
-
175
-
176
-
177
-
178
-
179
-
180
-
181
-
182
-
183
-
184
-
185
-
186
-
187
-
188
-
189
-
190
-
191
-
192
-
193
-
194
-
195
-
196
-
197
-
198
-
199
-
200
-
201
-
202
-
203
-
204
-
205
-
206
-
207
-
208
-
209
-
210
-
211
-
212
-
213
-
214
-
215
-
216
-
217
-
218
-
219
-
220
-
221
-
222
-
223
-
224
-
225
-
226
-
227
-
228
-
229
-
230
-
231
-
232
-
233
-
234
-
235
-
236
-
237
-
238
-
239
-
240
-
241
-
242
-
243
-
244
-
245
-
246
-
247
-
248
-
249
-
250
-
251
-
252
-
253
-
254
-
255
-
256
-
257
-
258
-
259
-
260
-
261
-
262
-
263
-
264
-
265
-
266
-
267
-
268
-
269
-
270
-
271
-
272
-
273
-
274
-
275
-
276
-
277
-
278
-
279
-
280
-
281
-
282
-
283
-
284
-
285
-
286
-
287
-
288
-
289
-
290
-
291
-
292
-
293
-
294
-
295
-
296
-
297
-
298
-
299
-
300
-
301
-
302
-
303
-
304
-
305
-
306
-
307
-
308
-
309
-
310
-
311
-
312
-
313
-
314
-
315
-
316
-
317
-
318
-
319
-
320
-
321
-
322
-
323
-
324
-
325
-
326
-
327
-
328
-
329
-
330
-
331
-
332
-
333
-
334
-
335
-
336
-
337
-
338
-
339
-
340
-
341
-
342
-
343
-
344
-
345
-
346
-
347
-
348
-
349
-
350
-
351
-
352
-
353
-
354
-
355
-
356
-
357
-
358
-
359
-
360
-
361
-
362
-
363
-
364
-
365
-
366
-
367
-
368
-
369
-
370
-
371
-
372
-
373
-
374
-
375
-
376
-
377
-
378
-
379
-
380
-
381
-
382
-
383
-
384
-
385
-
386
-
387
-
388
-
389
-
390
 |
 |

Business review continued
RBS Group Annual Report and Accounts 2009138
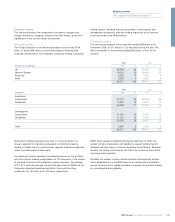
The global automotive industry continues to face long-term structural
challenges of overcapacity, weakened consumer demand owing to
economic conditions, reduced credit availability and high input costs.
The global OEMs are experiencing changing demand patterns with a
greater focus on developing markets versus their established markets.
Shifting production capacity to lower cost overseas locations remains a
priority but one that risks labour force issues. The industry is also
challenged by increasingly stringent environmental legislation that is
forcing a shift to smaller, lower emission vehicles. In 2009 the automotive
industry benefited from considerable government support in the form of
direct intervention (US manufacturers) and other forms (for example, car
scrappage schemes). Whilst there are some emerging signs of recovery
and stability, albeit with volumes at historically low levels, the outlook
remains fragile as government support is withdrawn and underlying
demand is likely to remain subdued.
The portfolio has been reduced in size by a third since 31 December 2008
and whilst average credit quality was impacted by the restructuring of
the large US manufacturers at the start of 2009, this restructuring
provided a degree of stability to the portfolio that was largely
maintained for the remainder of the year. Impairment provisions to date
have not been material.
Credit risk continued
Credit risk assets*continued
Corporate sectors continued
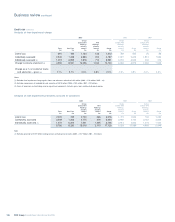
Transport and storage
The automotive, shipping and aviation portfolios form part of the transport
and storage industry sector, which stood at £46.2 billion at 31 December
2009, down 22% during the year. The remainder of the portfolio largely
comprises land-based freight, storage and logistics companies.
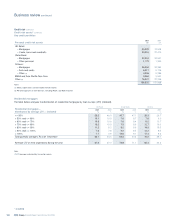
Automotive
Exposure to the automotive sector decreased from £13.3 billion at 31
December 2008 to £8.9 billion at 31 December 2009.
2009 2008
Core Non-Core Total Total
Segment £m £m £m % £m %
Original equipment manufacturers (OEMs) 1,204 60 1,264 14 2,681 20
Captive finance companies 609 84 693 8 1,131 9
Component suppliers 750 81 831 9 1,854 14
Retailers/services 4,040 766 4,806 54 5,099 38
Rental 1,150 147 1,297 15 2,533 19
7,753 1,138 8,891 100 13,298 100
2009 2008
Core Non-Core Total Total
Domicile of obligor £m £m £m % £m %
Americas 1,325 402 1,727 19 3,520 26
Central Eastern Europe, Middle East and Africa 373 152 525 6 872 7
UK 3,530 426 3,956 45 3,884 29
Other Europe 1,949 97 2,046 23 4,098 31
Asia 576 61 637 7 924 7
7,753 1,138 8,891 100 13,298 100
* unaudited