RBS 2009 Annual Report Download - page 270
Download and view the complete annual report
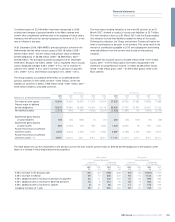
Please find page 270 of the 2009 RBS annual report below. You can navigate through the pages in the report by either clicking on the pages listed below, or by using the keyword search tool below to find specific information within the annual report.-
 1
1 -
2
-
3
-
4
-
5
-
6
-
7
-
8
-
9
-
10
-
11
-
12
-
13
-
14
-
15
-
16
-
17
-
18
-
19
-
20
-
21
-
22
-
23
-
24
-
25
-
26
-
27
-
28
-
29
-
30
-
31
-
32
-
33
-
34
-
35
-
36
-
37
-
38
-
39
-
40
-
41
-
42
-
43
-
44
-
45
-
46
-
47
-
48
-
49
-
50
-
51
-
52
-
53
-
54
-
55
-
56
-
57
-
58
-
59
-
60
-
61
-
62
-
63
-
64
-
65
-
66
-
67
-
68
-
69
-
70
-
71
-
72
-
73
-
74
-
75
-
76
-
77
-
78
-
79
-
80
-
81
-
82
-
83
-
84
-
85
-
86
-
87
-
88
-
89
-
90
-
91
-
92
-
93
-
94
-
95
-
96
-
97
-
98
-
99
-
100
-
101
-
102
-
103
-
104
-
105
-
106
-
107
-
108
-
109
-
110
-
111
-
112
-
113
-
114
-
115
-
116
-
117
-
118
-
119
-
120
-
121
-
122
-
123
-
124
-
125
-
126
-
127
-
128
-
129
-
130
-
131
-
132
-
133
-
134
-
135
-
136
-
137
-
138
-
139
-
140
-
141
-
142
-
143
-
144
-
145
-
146
-
147
-
148
-
149
-
150
-
151
-
152
-
153
-
154
-
155
-
156
-
157
-
158
-
159
-
160
-
161
-
162
-
163
-
164
-
165
-
166
-
167
-
168
-
169
-
170
-
171
-
172
-
173
-
174
-
175
-
176
-
177
-
178
-
179
-
180
-
181
-
182
-
183
-
184
-
185
-
186
-
187
-
188
-
189
-
190
-
191
-
192
-
193
-
194
-
195
-
196
-
197
-
198
-
199
-
200
-
201
-
202
-
203
-
204
-
205
-
206
-
207
-
208
-
209
-
210
-
211
-
212
-
213
-
214
-
215
-
216
-
217
-
218
-
219
-
220
-
221
-
222
-
223
-
224
-
225
-
226
-
227
-
228
-
229
-
230
-
231
-
232
-
233
-
234
-
235
-
236
-
237
-
238
-
239
-
240
-
241
-
242
-
243
-
244
-
245
-
246
-
247
-
248
-
249
-
250
-
251
-
252
-
253
-
254
-
255
-
256
-
257
-
258
-
259
-
 260
260 -
 261
261 -
 262
262 -
 263
263 -
 264
264 -
 265
265 -
 266
266 -
 267
267 -
 268
268 -
 269
269 -
 270
270 -
 271
271 -
 272
272 -
 273
273 -
 274
274 -
 275
275 -
 276
276 -
 277
277 -
 278
278 -
 279
279 -
 280
280 -
281
-
282
-
283
-
284
-
285
-
286
-
287
-
288
-
289
-
290
-
291
-
292
-
293
-
294
-
295
-
296
-
297
-
298
-
299
-
300
-
301
-
302
-
303
-
304
-
305
-
306
-
307
-
308
-
309
-
310
-
311
-
312
-
313
-
314
-
315
-
316
-
317
-
318
-
319
-
320
-
321
-
322
-
323
-
324
-
325
-
326
-
327
-
328
-
329
-
330
-
331
-
332
-
333
-
334
-
335
-
336
-
337
-
338
-
339
-
340
-
341
-
342
-
343
-
344
-
345
-
346
-
347
-
348
-
349
-
350
-
351
-
352
-
353
-
354
-
355
-
356
-
357
-
358
-
359
-
360
-
361
-
362
-
363
-
364
-
365
-
366
-
367
-
368
-
369
-
370
-
371
-
372
-
373
-
374
-
375
-
376
-
377
-
378
-
379
-
380
-
381
-
382
-
383
-
384
-
385
-
386
-
387
-
388
-
389
-
390
 |
 |

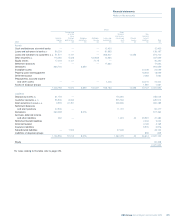
Notes on the accounts continued
RBS Group Annual Report and Accounts 2009268
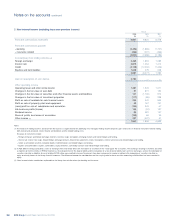
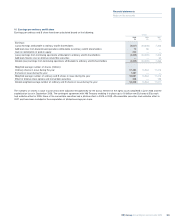
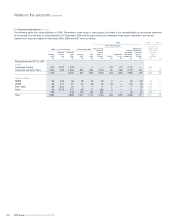
8 Ordinary dividends
Prior year ordinary dividends per share in the table below were restated for the effect of the rights issue in June 2008 and the capitalisation issue in
September 2008.
Group
2009 2008 2007 2009 2008 2007
p per share p per share p per share £m £m £m
Final dividend for previous year declared during the current year — 19.3 18.5 —2,312 2,091
Interim dividend — — 8.5 —— 953
Total dividends paid on ordinary equity shares — 19.3 27.0 —2,312 3,044
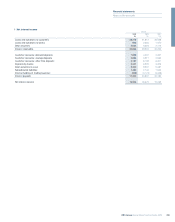
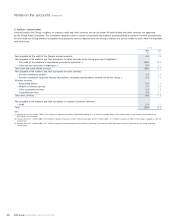
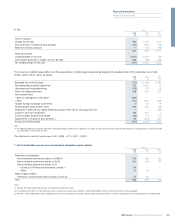
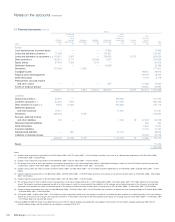
9 Profit dealt with in the accounts of the company
As permitted by section 408(3) of the Companies Act 2006, the primary financial statements of the company do not include an income statement or
statement of comprehensive income. Condensed information is set out below:
Company
2009 2008 2007
Income statement £m £m £m
Dividends received from banking subsidiary 2,523 4,639 2,330
Dividends received from other subsidiaries 408 163 415
Gain on redemption of own debt 238 ——
Total income 3,169 4,802 2,745
Interest receivable from subsidiaries 997 793 460
Interest payable to subsidiaries (251) (495) (307)
Other net interest payable and operating expenses (62) (796) (526)
Write-down of investments in subsidiaries (5,139) (14,321) —
Operating (loss)/profit before tax (1,286) (10,017) 2,372
Tax (217) 415 127
(Loss)/profit for the year (1,503) (9,602) 2,499
(Loss)/profit attributable to:
Preference shareholders 878 536 246
Paid-in equity holders 57 60 —
Ordinary and B shareholders (2,438) (10,198) 2,253
(1,503) (9,602) 2,499
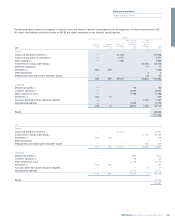
Company
2009 2008 2007
Statement of comprehensive income £m £m £m
(Loss)/profit for the year (1,503) (9,602) 2,499
Other comprehensive income:
Cash flow hedges 323
Tax on comprehensive income —(1) (1)
Other comprehensive income for the year, net of tax 3 12
Total comprehensive income for the year (1,500) (9,601) 2,501
Attributable to:
Preference shareholders 878 536 246
Paid-in equity holders 57 60 —
Ordinary and B shareholders (2,435) (10,197) 2,255
Total comprehensive income for the year (1,500) (9,601) 2,501