RBS 2009 Annual Report Download - page 281
Download and view the complete annual report
Please find page 281 of the 2009 RBS annual report below. You can navigate through the pages in the report by either clicking on the pages listed below, or by using the keyword search tool below to find specific information within the annual report.-
 1
1 -
2
-
3
-
4
-
5
-
6
-
7
-
8
-
9
-
10
-
11
-
12
-
13
-
14
-
15
-
16
-
17
-
18
-
19
-
20
-
21
-
22
-
23
-
24
-
25
-
26
-
27
-
28
-
29
-
30
-
31
-
32
-
33
-
34
-
35
-
36
-
37
-
38
-
39
-
40
-
41
-
42
-
43
-
44
-
45
-
46
-
47
-
48
-
49
-
50
-
51
-
52
-
53
-
54
-
55
-
56
-
57
-
58
-
59
-
60
-
61
-
62
-
63
-
64
-
65
-
66
-
67
-
68
-
69
-
70
-
71
-
72
-
73
-
74
-
75
-
76
-
77
-
78
-
79
-
80
-
81
-
82
-
83
-
84
-
85
-
86
-
87
-
88
-
89
-
90
-
91
-
92
-
93
-
94
-
95
-
96
-
97
-
98
-
99
-
100
-
101
-
102
-
103
-
104
-
105
-
106
-
107
-
108
-
109
-
110
-
111
-
112
-
113
-
114
-
115
-
116
-
117
-
118
-
119
-
120
-
121
-
122
-
123
-
124
-
125
-
126
-
127
-
128
-
129
-
130
-
131
-
132
-
133
-
134
-
135
-
136
-
137
-
138
-
139
-
140
-
141
-
142
-
143
-
144
-
145
-
146
-
147
-
148
-
149
-
150
-
151
-
152
-
153
-
154
-
155
-
156
-
157
-
158
-
159
-
160
-
161
-
162
-
163
-
164
-
165
-
166
-
167
-
168
-
169
-
170
-
171
-
172
-
173
-
174
-
175
-
176
-
177
-
178
-
179
-
180
-
181
-
182
-
183
-
184
-
185
-
186
-
187
-
188
-
189
-
190
-
191
-
192
-
193
-
194
-
195
-
196
-
197
-
198
-
199
-
200
-
201
-
202
-
203
-
204
-
205
-
206
-
207
-
208
-
209
-
210
-
211
-
212
-
213
-
214
-
215
-
216
-
217
-
218
-
219
-
220
-
221
-
222
-
223
-
224
-
225
-
226
-
227
-
228
-
229
-
230
-
231
-
232
-
233
-
234
-
235
-
236
-
237
-
238
-
239
-
240
-
241
-
242
-
243
-
244
-
245
-
246
-
247
-
248
-
249
-
250
-
251
-
252
-
253
-
254
-
255
-
256
-
257
-
258
-
259
-
260
-
261
-
262
-
263
-
264
-
265
-
266
-
267
-
268
-
269
-
270
-
 271
271 -
 272
272 -
 273
273 -
 274
274 -
 275
275 -
 276
276 -
 277
277 -
 278
278 -
 279
279 -
 280
280 -
 281
281 -
 282
282 -
 283
283 -
 284
284 -
 285
285 -
 286
286 -
 287
287 -
 288
288 -
 289
289 -
 290
290 -
 291
291 -
292
-
293
-
294
-
295
-
296
-
297
-
298
-
299
-
300
-
301
-
302
-
303
-
304
-
305
-
306
-
307
-
308
-
309
-
310
-
311
-
312
-
313
-
314
-
315
-
316
-
317
-
318
-
319
-
320
-
321
-
322
-
323
-
324
-
325
-
326
-
327
-
328
-
329
-
330
-
331
-
332
-
333
-
334
-
335
-
336
-
337
-
338
-
339
-
340
-
341
-
342
-
343
-
344
-
345
-
346
-
347
-
348
-
349
-
350
-
351
-
352
-
353
-
354
-
355
-
356
-
357
-
358
-
359
-
360
-
361
-
362
-
363
-
364
-
365
-
366
-
367
-
368
-
369
-
370
-
371
-
372
-
373
-
374
-
375
-
376
-
377
-
378
-
379
-
380
-
381
-
382
-
383
-
384
-
385
-
386
-
387
-
388
-
389
-
390
 |
 |

Financial statements
Notes on the accounts
279RBS Group Annual Report and Accounts 2009
Valuation techniques
The Group uses a number of methodologies to determine the fair values
of financial instruments for which observable prices in active markets for
identical instruments are not available. These techniques include: relative
value methodologies based on observable prices for similar instruments;
present value approaches where future cash flows from the asset or
liability are estimated and then discounted using a risk-adjusted interest
rate; option pricing models (such as Black-Scholes or binomial option
pricing models) and simulation models such as Monte-Carlo.
The principal inputs to these valuation techniques are listed below.
Values between and beyond available data points are obtained by
interpolation and extrapolation. When utilising valuation techniques, the
fair value can be significantly affected by the choice of valuation model
and by underlying assumptions concerning factors such as the amounts
and timing of cash flows, discount rates and credit risk.
•Bond prices – quoted prices are generally available for government
bonds, certain corporate securities and some mortgage-related
products.
•Credit spreads – where available, these are derived from prices of
CDS or other credit based instruments, such as debt securities. For
others, credit spreads are obtained from pricing services.
•Interest rates – these are principally benchmark interest rates such
as the London Inter-Bank Offered Rate (LIBOR) and quoted interest
rates in the swap, bond and futures markets.
•Foreign currency exchange rates – there are observable markets
both for spot and forward contracts and futures in the world’s major
currencies.
•Equity and equity index prices – quoted prices are generally readily
available for equity shares listed on the world’s major stock
exchanges and for major indices on such shares.
•Commodity prices – many commodities are actively traded in spot
and forward contracts and futures on exchanges in London, New
York and other commercial centres.
•Price volatilities and correlations – volatility is a measure of the
tendency of a price to change with time. Correlation measures the
degree to which two or more prices or other variables are observed
to move together. If they move in the same direction there is positive
correlation; if they move in opposite directions there is negative
correlation. Volatility is a key input in valuing options and the
valuation of certain products such as derivatives with more than one
underlying variable that are correlation-dependent. Volatility and
correlation values are obtained from broker quotations, pricing
services or derived from option prices.
•Prepayment rates – the fair value of a financial instrument that can
be prepaid by the issuer or borrower differs from that of an
instrument that cannot be prepaid. In valuing prepayable instruments
that are not quoted in active markets, the Group considers the value
of the prepayment option.
•Counterparty credit spreads – adjustments are made to market
prices (or parameters) when the creditworthiness of the counterparty
differs from that of the assumed counterparty in the market price (or
parameters).
•Recovery rates/loss given default – these are used as an input to
valuation models and reserves for ABS and other credit products as
an indicator of severity of losses on default. Recovery rates are
primarily sourced from market data providers or inferred from
observable credit spreads.
In order to determine a reliable fair value, where appropriate,
management applies valuation adjustments to the pricing information
gathered from the above sources. These adjustments reflect the Group’s
assessment of factors that market participants would consider in setting
a price, to the extent that these factors are not reflected in that pricing
information. Furthermore, on an ongoing basis, the Group assesses the
appropriateness of any model used. To the extent that the price
provided by internal models does not represent the fair value of the
instrument, for instance in highly stressed market conditions, the Group
makes adjustments to the model valuation to calibrate to other available
pricing sources. Where unobservable inputs are used, the Group may
determine a range of possible valuations derived from differing stress
scenarios to determine the sensitivity associated with the valuation.
When establishing the fair value of a financial instrument using a
valuation technique, the Group considers certain adjustments to the
modelled price which market participants would make when pricing that
instrument. Such adjustments include the credit quality of the
counterparty and adjustments to compensate for any known model
limitations.
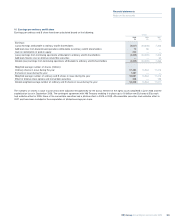
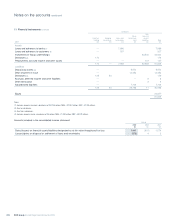
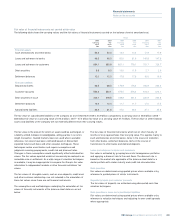
On initial recognition of financial assets and liabilities valued using
valuation techniques incorporating information other than observable
market data, any difference between the transaction price and that
derived from the valuation technique is deferred. Such amounts are
recognised in profit or loss over the life of the transaction; when market
data become observable; or when the transaction matures or is closed
out as appropriate. At 31 December 2009, net gains of £204 million
(2008 – £102 million; 2007 – £72 million) were carried forward in the
balance sheet. During the year net gains of £127 million (2008 – £89
million; 2007 – £67 million) were deferred and £25 million (2008 – £65
million; 2007 – £10 million) recognised in the income statement.