RBS 2009 Annual Report Download - page 297
Download and view the complete annual report
Please find page 297 of the 2009 RBS annual report below. You can navigate through the pages in the report by either clicking on the pages listed below, or by using the keyword search tool below to find specific information within the annual report.-
 1
1 -
2
-
3
-
4
-
5
-
6
-
7
-
8
-
9
-
10
-
11
-
12
-
13
-
14
-
15
-
16
-
17
-
18
-
19
-
20
-
21
-
22
-
23
-
24
-
25
-
26
-
27
-
28
-
29
-
30
-
31
-
32
-
33
-
34
-
35
-
36
-
37
-
38
-
39
-
40
-
41
-
42
-
43
-
44
-
45
-
46
-
47
-
48
-
49
-
50
-
51
-
52
-
53
-
54
-
55
-
56
-
57
-
58
-
59
-
60
-
61
-
62
-
63
-
64
-
65
-
66
-
67
-
68
-
69
-
70
-
71
-
72
-
73
-
74
-
75
-
76
-
77
-
78
-
79
-
80
-
81
-
82
-
83
-
84
-
85
-
86
-
87
-
88
-
89
-
90
-
91
-
92
-
93
-
94
-
95
-
96
-
97
-
98
-
99
-
100
-
101
-
102
-
103
-
104
-
105
-
106
-
107
-
108
-
109
-
110
-
111
-
112
-
113
-
114
-
115
-
116
-
117
-
118
-
119
-
120
-
121
-
122
-
123
-
124
-
125
-
126
-
127
-
128
-
129
-
130
-
131
-
132
-
133
-
134
-
135
-
136
-
137
-
138
-
139
-
140
-
141
-
142
-
143
-
144
-
145
-
146
-
147
-
148
-
149
-
150
-
151
-
152
-
153
-
154
-
155
-
156
-
157
-
158
-
159
-
160
-
161
-
162
-
163
-
164
-
165
-
166
-
167
-
168
-
169
-
170
-
171
-
172
-
173
-
174
-
175
-
176
-
177
-
178
-
179
-
180
-
181
-
182
-
183
-
184
-
185
-
186
-
187
-
188
-
189
-
190
-
191
-
192
-
193
-
194
-
195
-
196
-
197
-
198
-
199
-
200
-
201
-
202
-
203
-
204
-
205
-
206
-
207
-
208
-
209
-
210
-
211
-
212
-
213
-
214
-
215
-
216
-
217
-
218
-
219
-
220
-
221
-
222
-
223
-
224
-
225
-
226
-
227
-
228
-
229
-
230
-
231
-
232
-
233
-
234
-
235
-
236
-
237
-
238
-
239
-
240
-
241
-
242
-
243
-
244
-
245
-
246
-
247
-
248
-
249
-
250
-
251
-
252
-
253
-
254
-
255
-
256
-
257
-
258
-
259
-
260
-
261
-
262
-
263
-
264
-
265
-
266
-
267
-
268
-
269
-
270
-
271
-
272
-
273
-
274
-
275
-
276
-
277
-
278
-
279
-
280
-
281
-
282
-
283
-
284
-
285
-
286
-
 287
287 -
 288
288 -
 289
289 -
 290
290 -
 291
291 -
 292
292 -
 293
293 -
 294
294 -
 295
295 -
 296
296 -
 297
297 -
 298
298 -
 299
299 -
 300
300 -
 301
301 -
 302
302 -
 303
303 -
 304
304 -
 305
305 -
 306
306 -
 307
307 -
308
-
309
-
310
-
311
-
312
-
313
-
314
-
315
-
316
-
317
-
318
-
319
-
320
-
321
-
322
-
323
-
324
-
325
-
326
-
327
-
328
-
329
-
330
-
331
-
332
-
333
-
334
-
335
-
336
-
337
-
338
-
339
-
340
-
341
-
342
-
343
-
344
-
345
-
346
-
347
-
348
-
349
-
350
-
351
-
352
-
353
-
354
-
355
-
356
-
357
-
358
-
359
-
360
-
361
-
362
-
363
-
364
-
365
-
366
-
367
-
368
-
369
-
370
-
371
-
372
-
373
-
374
-
375
-
376
-
377
-
378
-
379
-
380
-
381
-
382
-
383
-
384
-
385
-
386
-
387
-
388
-
389
-
390
 |
 |

Financial statements
Notes on the accounts
295RBS Group Annual Report and Accounts 2009
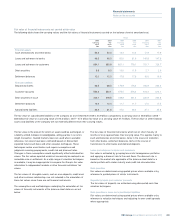
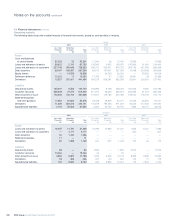
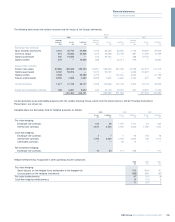
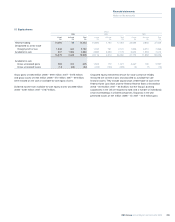
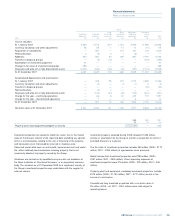
The following table shows the notional amounts and fair values of the Group’s derivatives.
Group
2009 2008 2007
Notional Notional Notional
amounts Assets Liabilities amounts Assets Liabilities amounts Assets Liabilities
£bn £m £m £bn £m £m £bn £m £m
Exchange rate contracts
Spot, forwards and futures 2,004 26,744 24,898 2,316 83,065 83,568 2,134 29,829 29,629
Currency swaps 922 25,883 23,466 1,074 53,398 54,728 887 14,785 13,789
Options purchased 440 16,656 — 616 36,762 — 488 13,750 —
Options written 476 — 15,555 668 — 35,017 519 — 13,892
Interest rate contracts
Interest rate swaps 30,956 265,528 253,793 37,901 548,040 532,180 24,798 142,470 141,479
Options purchased 3,180 55,976 — 5,673 99,192 — 4,084 30,681 —
Options written 2,539 — 55,589 3,775 — 102,216 3,640 — 31,199
Futures and forwards 6,555 2,088 2,033 8,555 7,600 6,620 3,164 807 987
Credit derivatives 1,621 41,748 39,127 2,208 142,366 132,734 2,402 34,123 29,855
Equity and commodity contracts 188 6,831 9,680 622 22,136 24,301 281 10,957 11,222
441,454 424,141 992,559 971,364 277,402 272,052
Certain derivative asset and liability balances with the London Clearing House, which meet the offset criteria in IAS 32 ‘Financial Instruments:
Presentation’, are shown net.
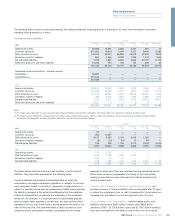
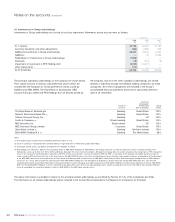
Included above are derivatives held for hedging purposes as follows:
2009 2008 2007
Assets Liabilities Assets Liabilities Assets Liabilities
£m £m £m £m £m £m
Fair value hedging:
Exchange rate contracts 160 38 1,257 1,412 62 344
Interest rate contracts 2,672 3,292 2,944 3,330 1,598 1,062
Cash flow hedging:
Exchange rate contracts 2 7 2 90 155 78
Interest rate contracts 1,753 3,080 2,503 2,834 738 1,014
Commodity contracts — — 39 14 — —
Net investment hedging:
Exchange rate contracts 10 90 114 596 — 211
Hedge ineffectiveness recognised in other operating income comprised:
2009 2008 2007
£m £m £m
Fair value hedging:
Gains/(losses) on the hedged items attributable to the hedged risk 512 (965) 81
(Losses)/gains on the hedging instruments (455) 884 (87)
Fair value ineffectiveness 57 (81) (6)
Cash flow hedging ineffectiveness 14 (16) 9
71 (97) 3