RBS 2009 Annual Report Download - page 166
Download and view the complete annual report
Please find page 166 of the 2009 RBS annual report below. You can navigate through the pages in the report by either clicking on the pages listed below, or by using the keyword search tool below to find specific information within the annual report.-
 1
1 -
2
-
3
-
4
-
5
-
6
-
7
-
8
-
9
-
10
-
11
-
12
-
13
-
14
-
15
-
16
-
17
-
18
-
19
-
20
-
21
-
22
-
23
-
24
-
25
-
26
-
27
-
28
-
29
-
30
-
31
-
32
-
33
-
34
-
35
-
36
-
37
-
38
-
39
-
40
-
41
-
42
-
43
-
44
-
45
-
46
-
47
-
48
-
49
-
50
-
51
-
52
-
53
-
54
-
55
-
56
-
57
-
58
-
59
-
60
-
61
-
62
-
63
-
64
-
65
-
66
-
67
-
68
-
69
-
70
-
71
-
72
-
73
-
74
-
75
-
76
-
77
-
78
-
79
-
80
-
81
-
82
-
83
-
84
-
85
-
86
-
87
-
88
-
89
-
90
-
91
-
92
-
93
-
94
-
95
-
96
-
97
-
98
-
99
-
100
-
101
-
102
-
103
-
104
-
105
-
106
-
107
-
108
-
109
-
110
-
111
-
112
-
113
-
114
-
115
-
116
-
117
-
118
-
119
-
120
-
121
-
122
-
123
-
124
-
125
-
126
-
127
-
128
-
129
-
130
-
131
-
132
-
133
-
134
-
135
-
136
-
137
-
138
-
139
-
140
-
141
-
142
-
143
-
144
-
145
-
146
-
147
-
148
-
149
-
150
-
151
-
152
-
153
-
154
-
155
-
 156
156 -
 157
157 -
 158
158 -
 159
159 -
 160
160 -
 161
161 -
 162
162 -
 163
163 -
 164
164 -
 165
165 -
 166
166 -
 167
167 -
 168
168 -
 169
169 -
 170
170 -
 171
171 -
 172
172 -
 173
173 -
 174
174 -
 175
175 -
 176
176 -
177
-
178
-
179
-
180
-
181
-
182
-
183
-
184
-
185
-
186
-
187
-
188
-
189
-
190
-
191
-
192
-
193
-
194
-
195
-
196
-
197
-
198
-
199
-
200
-
201
-
202
-
203
-
204
-
205
-
206
-
207
-
208
-
209
-
210
-
211
-
212
-
213
-
214
-
215
-
216
-
217
-
218
-
219
-
220
-
221
-
222
-
223
-
224
-
225
-
226
-
227
-
228
-
229
-
230
-
231
-
232
-
233
-
234
-
235
-
236
-
237
-
238
-
239
-
240
-
241
-
242
-
243
-
244
-
245
-
246
-
247
-
248
-
249
-
250
-
251
-
252
-
253
-
254
-
255
-
256
-
257
-
258
-
259
-
260
-
261
-
262
-
263
-
264
-
265
-
266
-
267
-
268
-
269
-
270
-
271
-
272
-
273
-
274
-
275
-
276
-
277
-
278
-
279
-
280
-
281
-
282
-
283
-
284
-
285
-
286
-
287
-
288
-
289
-
290
-
291
-
292
-
293
-
294
-
295
-
296
-
297
-
298
-
299
-
300
-
301
-
302
-
303
-
304
-
305
-
306
-
307
-
308
-
309
-
310
-
311
-
312
-
313
-
314
-
315
-
316
-
317
-
318
-
319
-
320
-
321
-
322
-
323
-
324
-
325
-
326
-
327
-
328
-
329
-
330
-
331
-
332
-
333
-
334
-
335
-
336
-
337
-
338
-
339
-
340
-
341
-
342
-
343
-
344
-
345
-
346
-
347
-
348
-
349
-
350
-
351
-
352
-
353
-
354
-
355
-
356
-
357
-
358
-
359
-
360
-
361
-
362
-
363
-
364
-
365
-
366
-
367
-
368
-
369
-
370
-
371
-
372
-
373
-
374
-
375
-
376
-
377
-
378
-
379
-
380
-
381
-
382
-
383
-
384
-
385
-
386
-
387
-
388
-
389
-
390
 |
 |
Business review continued
RBS Group Annual Report and Accounts 2009164
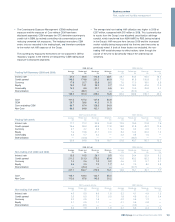
Market risk continued
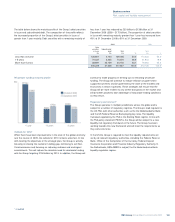
The 2008 and 2009 data on trading VaR in the tables on the previous
page excludes exposures to super-senior tranches of asset backed
CDOs, as VaR does not produce an appropriate measure of risk for
these exposures due to the illiquidity and opaqueness of the pricing of
these instruments over an extended period. For these exposures, the
maximum potential loss is equal to the aggregate net exposure, which
was £910 million as at 31 December 2009.
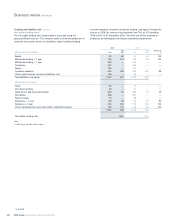
The 2009 data in the tables on the previous page also excludes the
exposures relating to CDPCs from the end of August 2009 when they
were excluded from VaR and were capitalised under a Pillar II
approach.
RBS Sempra Commodities LLP (Sempra), the commodities-marketing
joint venture between RBS and Sempra Energy, was formed on 1 April
2008, and its trading risks were included in the disclosed VaR from that
date. Sempra is designated as Non-Core in the 2009 data.
The trading and non-trading VaR for 2007 is shown on the basis it was
previously disclosed at a 95% confidence level and using a normalised
scaling factor to convert to 99% confidence level.
Non trading VaR in the tables on the previous page does not include
structural interest rate risk which is covered on page 165.
Back-testing, stress testing and sensitivity analysis
The Group undertakes a programme of daily back-testing, which compares
the actual profit or loss realised in trading activity to the VaR estimation. The
results of the back-testing process are one of the methods by which the
Group monitors the ongoing suitability of its VaR model.
The Group undertakes daily stress testing to identify the potential losses
in excess of VaR. Stress testing is used to calculate a range of trading
book exposures which result from exceptional, but plausible market
events. Stress testing measures the impact of abnormal changes in
market rates and prices on the fair value of the Group’s trading portfolios.
The Group calculates historical stress tests and hypothetical stress tests.
Historical stress tests calculate the loss that would be generated if the
market movements that occurred during historical market events were
repeated. Hypothetical stress tests calculate the loss that would be
generated if a specific set of adverse market movements were to occur.
Stress testing is also undertaken at key trading strategy level, for those
strategies where the associated market risks are not adequately
captured by VaR. Stress test exposures are discussed with senior
management and are reported to GRC, ERF and the Board. Breaches in
the Group’s market risk stress testing limits are monitored and reported.
In addition to VaR and stress testing, the Group calculates a wide range
of sensitivity and position risk measures, for example interest rate
ladders or option revaluation matrices. These measures provide valuable
additional controls, often at individual desk or strategy level.
Model validation governance
Pricing models are developed and owned by the front office. Where
pricing models are used as the basis of books and records valuations,
they are all subject to independent review and sign-off. Models are
assessed by GMPRC as having either immaterial or material model risk
(valuation uncertainty arising from choice of modelling assumptions),
the assessment being made on the basis of expert judgement.
Those models assessed by the GMPRC as having material model risk
are prioritised for independent quantitative review. Independent
quantitative review aims to quantify model risk (i.e. the impact of missing
risk factors in the front office model or the possibility that we may be
mismarking these products relative to other market participants who may
be using an alternative model) by comparing model outputs against
alternative independently developed models. The results of independent
quantitative reviews are used by market risk to inform risk limits and by
finance to inform reserves. Governance over this process is provided by
GMPRC, a forum which brings together front office quantative analysts,
market risk, finance and QuaRC (Quantitative Research Centre, Group
Risk’s independent quantitative model review function). Risk (market risk,
incremental default risk, counterparty credit risk) models are developed
both within business units and by Group functions. Risk models are also
subject to independent review and sign-off. Meetings are held with the
FSA every quarter to discuss the traded market risk, including changes
in models, management, back testing results, other risks not included in
the VaR framework and other model performance statistics.
Risk control
All divisions that are exposed to market risk in the course of their
business are required to comply with the Group’s Market Risk Policy
Standards (MRPS). The main risk management tools are delegated
authorities, hard limits and discussion triggers, independent model
valuation, a robust and efficient risk system and timely and accurate
management information.
Limits form part of the dealing authorities and constitute one of the
cornerstones of the market risk management framework. Upon
notification of a limit breach, the appropriate body must take one of the
following actions:
•Instructions can be given to reduce positions so as to bring the
Group within the agreed limits;
•A temporary increase in the limit can be granted to pursue an
agreed short-term strategy; and
•A permanent increase in the limit can be granted if consistent with
the strategy and supported by the business and Risk Management.
Non-traded portfolios
Risks in non-traded portfolios mainly arise in retail and commercial
banking assets and liabilities and financial investments designated as
available-for-sale and held-to-maturity.
Group Treasury is responsible for setting and monitoring the adequacy and
effectiveness of management, using a framework that identifies, measures,
monitors and controls the underlying risk. GALCO approves the Group’s
non-traded market risk appetite, expressed as statistical and non-statistical
risk limits, which are delegated to the businesses responsible.