RBS 2009 Annual Report Download - page 284
Download and view the complete annual report
Please find page 284 of the 2009 RBS annual report below. You can navigate through the pages in the report by either clicking on the pages listed below, or by using the keyword search tool below to find specific information within the annual report.-
 1
1 -
2
-
3
-
4
-
5
-
6
-
7
-
8
-
9
-
10
-
11
-
12
-
13
-
14
-
15
-
16
-
17
-
18
-
19
-
20
-
21
-
22
-
23
-
24
-
25
-
26
-
27
-
28
-
29
-
30
-
31
-
32
-
33
-
34
-
35
-
36
-
37
-
38
-
39
-
40
-
41
-
42
-
43
-
44
-
45
-
46
-
47
-
48
-
49
-
50
-
51
-
52
-
53
-
54
-
55
-
56
-
57
-
58
-
59
-
60
-
61
-
62
-
63
-
64
-
65
-
66
-
67
-
68
-
69
-
70
-
71
-
72
-
73
-
74
-
75
-
76
-
77
-
78
-
79
-
80
-
81
-
82
-
83
-
84
-
85
-
86
-
87
-
88
-
89
-
90
-
91
-
92
-
93
-
94
-
95
-
96
-
97
-
98
-
99
-
100
-
101
-
102
-
103
-
104
-
105
-
106
-
107
-
108
-
109
-
110
-
111
-
112
-
113
-
114
-
115
-
116
-
117
-
118
-
119
-
120
-
121
-
122
-
123
-
124
-
125
-
126
-
127
-
128
-
129
-
130
-
131
-
132
-
133
-
134
-
135
-
136
-
137
-
138
-
139
-
140
-
141
-
142
-
143
-
144
-
145
-
146
-
147
-
148
-
149
-
150
-
151
-
152
-
153
-
154
-
155
-
156
-
157
-
158
-
159
-
160
-
161
-
162
-
163
-
164
-
165
-
166
-
167
-
168
-
169
-
170
-
171
-
172
-
173
-
174
-
175
-
176
-
177
-
178
-
179
-
180
-
181
-
182
-
183
-
184
-
185
-
186
-
187
-
188
-
189
-
190
-
191
-
192
-
193
-
194
-
195
-
196
-
197
-
198
-
199
-
200
-
201
-
202
-
203
-
204
-
205
-
206
-
207
-
208
-
209
-
210
-
211
-
212
-
213
-
214
-
215
-
216
-
217
-
218
-
219
-
220
-
221
-
222
-
223
-
224
-
225
-
226
-
227
-
228
-
229
-
230
-
231
-
232
-
233
-
234
-
235
-
236
-
237
-
238
-
239
-
240
-
241
-
242
-
243
-
244
-
245
-
246
-
247
-
248
-
249
-
250
-
251
-
252
-
253
-
254
-
255
-
256
-
257
-
258
-
259
-
260
-
261
-
262
-
263
-
264
-
265
-
266
-
267
-
268
-
269
-
270
-
271
-
272
-
273
-
 274
274 -
 275
275 -
 276
276 -
 277
277 -
 278
278 -
 279
279 -
 280
280 -
 281
281 -
 282
282 -
 283
283 -
 284
284 -
 285
285 -
 286
286 -
 287
287 -
 288
288 -
 289
289 -
 290
290 -
 291
291 -
 292
292 -
 293
293 -
 294
294 -
295
-
296
-
297
-
298
-
299
-
300
-
301
-
302
-
303
-
304
-
305
-
306
-
307
-
308
-
309
-
310
-
311
-
312
-
313
-
314
-
315
-
316
-
317
-
318
-
319
-
320
-
321
-
322
-
323
-
324
-
325
-
326
-
327
-
328
-
329
-
330
-
331
-
332
-
333
-
334
-
335
-
336
-
337
-
338
-
339
-
340
-
341
-
342
-
343
-
344
-
345
-
346
-
347
-
348
-
349
-
350
-
351
-
352
-
353
-
354
-
355
-
356
-
357
-
358
-
359
-
360
-
361
-
362
-
363
-
364
-
365
-
366
-
367
-
368
-
369
-
370
-
371
-
372
-
373
-
374
-
375
-
376
-
377
-
378
-
379
-
380
-
381
-
382
-
383
-
384
-
385
-
386
-
387
-
388
-
389
-
390
 |
 |

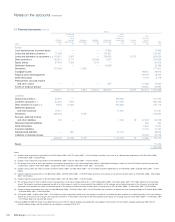
Notes on the accounts continued
RBS Group Annual Report and Accounts 2009282
Total Level 1 Level 2 Level 3 Level 3 sensitivity (2)
2009 £bn £bn £bn £bn £m £m Level 3 valuation technique and related assumptions
Assets
Loans and advances:
– banks 45.4 — 45.4 — — — n/a
– customers 44.3 — 43.2 1.1 80 (40) Proprietary model: credit spreads, indices
Debt securities
Government 146.8 130.1 16.7 — — — n/a
RMBS 57.7 — 57.2 0.5 30 (10) Industry standard model: prepayment rates,
probability of default, loss severity and yield
CMBS 4.1 — 4.0 0.1 30 — n/a
CDOs 3.6 — 2.6 1.0 130 (80) Proprietary model: implied collateral valuation,
default rates, housing prices, correlation
CLOs 8.8 — 8.0 0.8 80 (50) Industry standard simulation model: credit
spreads, recovery rates, correlation
Other ABS 6.1 — 5.2 0.9 120 (40) Proprietary model: credit spreads,
Corporate 11.4 — 10.8 0.6 70 (20) Proprietary model: credit spreads
Other (3) 18.9 0.2 18.5 0.2 10 (30) Proprietary model: credit spreads
257.4 130.3 123.0 4.1 470 (230)
Equity shares 19.5 15.4 2.6 1.5 280 (220) Valuation statements: fund valuation
Derivatives
Foreign exchange 69.4 — 69.2 0.2 10 — Proprietary model: volatility, correlation
Interest rate 323.6 0.3 321.8 1.5 80 (100) Proprietary model: volatility, correlation
Equities 6.5 0.4 5.8 0.3 20 (20) Proprietary model; volatility, correlation,
dividends
Commodities 0.3 — 0.3 — — — n/a
Credit – APS 1.4 — — 1.4 1,370 (1,540) Proprietary model: correlation, expected losses,
recovery rates, credit spreads
Credit – other 40.3 0.1 37.2 3.0 420 (360) Proprietary, industry option and correlation
models: counterparty credit risk, correlation,
volatility
441.5 0.8 434.3 6.4 1,900 (2,020)
Total assets 808.1 146.5 648.5 13.1 2,730 (2,510)
Liabilities
Deposits:
– banks 53.6 — 53.6 — — —
n/a
– customers 61.4 — 61.3 0.1 — (10) Proprietary model: credit spreads correlation
Debt securities in issue 45.5 — 43.2 2.3 50 (10) Proprietary model: volatility, correlation,
Short positions 40.5 27.1 13.2 0.2 10 (20) Proprietary model: credit spreads, correlation
Derivatives
Foreign exchange 63.9 — 63.9 — — — n/a
Interest rate 311.4 0.1 310.5 0.8 40 (60) Proprietary model: volatility, correlation,
Equities 9.5 1.0 8.3 0.2 20 (70) Proprietary model: volatility, correlation
dividends
Commodities 0.2 — 0.2 — — — n/a
Credit 39.1 — 38.1 1.0 80 (100) Proprietary CVA model, industry option and
correlation models: counterparty credit risk,
correlation, volatility
424.1 1.1 421.0 2.0 140 (230)
Other financial liabilities (4) 1.3 — 1.3 — — — n/a
Total liabilities 626.4 28.2 593.6 4.6 200 (270)
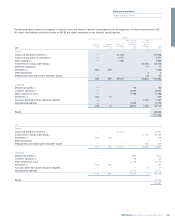
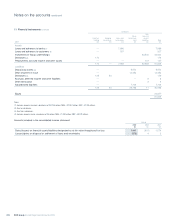
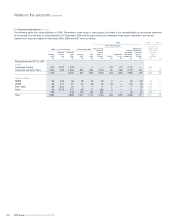
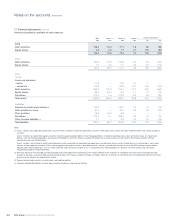
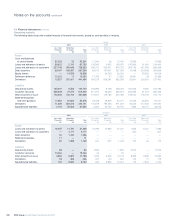
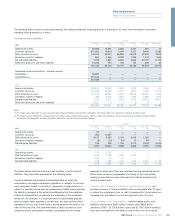
11 Financial instruments continued
Valuation hierarchy
The tables below show the financial instruments carried at fair value by
hierarchy – level 1, level 2 and level 3. The valuation techniques, main
assumptions used in the valuation of these instruments and reasonably
possible increases or decreases in fair value based on reasonably
possible alternative assumptions for level 3 financial instruments are set
out below.