RBS 2009 Annual Report Download - page 346
Download and view the complete annual report
Please find page 346 of the 2009 RBS annual report below. You can navigate through the pages in the report by either clicking on the pages listed below, or by using the keyword search tool below to find specific information within the annual report.-
 1
1 -
2
-
3
-
4
-
5
-
6
-
7
-
8
-
9
-
10
-
11
-
12
-
13
-
14
-
15
-
16
-
17
-
18
-
19
-
20
-
21
-
22
-
23
-
24
-
25
-
26
-
27
-
28
-
29
-
30
-
31
-
32
-
33
-
34
-
35
-
36
-
37
-
38
-
39
-
40
-
41
-
42
-
43
-
44
-
45
-
46
-
47
-
48
-
49
-
50
-
51
-
52
-
53
-
54
-
55
-
56
-
57
-
58
-
59
-
60
-
61
-
62
-
63
-
64
-
65
-
66
-
67
-
68
-
69
-
70
-
71
-
72
-
73
-
74
-
75
-
76
-
77
-
78
-
79
-
80
-
81
-
82
-
83
-
84
-
85
-
86
-
87
-
88
-
89
-
90
-
91
-
92
-
93
-
94
-
95
-
96
-
97
-
98
-
99
-
100
-
101
-
102
-
103
-
104
-
105
-
106
-
107
-
108
-
109
-
110
-
111
-
112
-
113
-
114
-
115
-
116
-
117
-
118
-
119
-
120
-
121
-
122
-
123
-
124
-
125
-
126
-
127
-
128
-
129
-
130
-
131
-
132
-
133
-
134
-
135
-
136
-
137
-
138
-
139
-
140
-
141
-
142
-
143
-
144
-
145
-
146
-
147
-
148
-
149
-
150
-
151
-
152
-
153
-
154
-
155
-
156
-
157
-
158
-
159
-
160
-
161
-
162
-
163
-
164
-
165
-
166
-
167
-
168
-
169
-
170
-
171
-
172
-
173
-
174
-
175
-
176
-
177
-
178
-
179
-
180
-
181
-
182
-
183
-
184
-
185
-
186
-
187
-
188
-
189
-
190
-
191
-
192
-
193
-
194
-
195
-
196
-
197
-
198
-
199
-
200
-
201
-
202
-
203
-
204
-
205
-
206
-
207
-
208
-
209
-
210
-
211
-
212
-
213
-
214
-
215
-
216
-
217
-
218
-
219
-
220
-
221
-
222
-
223
-
224
-
225
-
226
-
227
-
228
-
229
-
230
-
231
-
232
-
233
-
234
-
235
-
236
-
237
-
238
-
239
-
240
-
241
-
242
-
243
-
244
-
245
-
246
-
247
-
248
-
249
-
250
-
251
-
252
-
253
-
254
-
255
-
256
-
257
-
258
-
259
-
260
-
261
-
262
-
263
-
264
-
265
-
266
-
267
-
268
-
269
-
270
-
271
-
272
-
273
-
274
-
275
-
276
-
277
-
278
-
279
-
280
-
281
-
282
-
283
-
284
-
285
-
286
-
287
-
288
-
289
-
290
-
291
-
292
-
293
-
294
-
295
-
296
-
297
-
298
-
299
-
300
-
301
-
302
-
303
-
304
-
305
-
306
-
307
-
308
-
309
-
310
-
311
-
312
-
313
-
314
-
315
-
316
-
317
-
318
-
319
-
320
-
321
-
322
-
323
-
324
-
325
-
326
-
327
-
328
-
329
-
330
-
331
-
332
-
333
-
334
-
335
-
 336
336 -
 337
337 -
 338
338 -
 339
339 -
 340
340 -
 341
341 -
 342
342 -
 343
343 -
 344
344 -
 345
345 -
 346
346 -
 347
347 -
 348
348 -
 349
349 -
 350
350 -
 351
351 -
 352
352 -
 353
353 -
 354
354 -
 355
355 -
 356
356 -
357
-
358
-
359
-
360
-
361
-
362
-
363
-
364
-
365
-
366
-
367
-
368
-
369
-
370
-
371
-
372
-
373
-
374
-
375
-
376
-
377
-
378
-
379
-
380
-
381
-
382
-
383
-
384
-
385
-
386
-
387
-
388
-
389
-
390
 |
 |

RBS Group Annual Report and Accounts 2009344
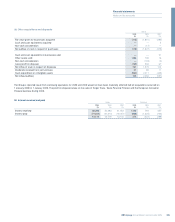
Notes on the accounts continued
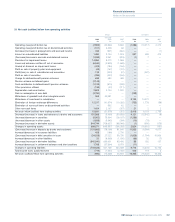
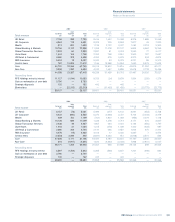
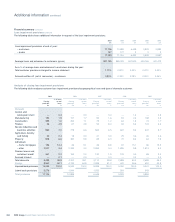
38 Segmental analysis continued
Group
2009 2008 2007
Cost to Cost to Cost to
acquire acquire acquire
fixed assets fixed assets fixed assets
and intangible and intangible and intangible
Assets Liabilities assets Assets Liabilities assets Assets Liabilities assets
£m £m £m £m £m £m £m £m £m
UK Retail 110,987 91,755 — 102,429 82,721 4 100,318 80,586 1
UK Corporate 114,854 89,306 598 120,990 84,076 1,418 103,332 68,643 1,467
Wealth 17,952 36,273 11 16,130 35,079 41 14,041 34,591 34
Global Banking & Markets 826,054 822,830 513 1,395,032 1,456,138 880 975,978 978,866 497
Global Transaction Services 18,380 64,684 17 22,162 54,259 7 21,821 58,148 8
Ulster Bank 44,021 40,597 — 49,107 47,672 1 42,453 44,004 32
US Retail & Commercial 75,369 72,407 179 88,673 89,254 204 67,099 55,874 171
RBS Insurance 11,973 7,775 33 11,018 7,510 61 10,574 7,036 92
Central items 82,041 150,739 804 70,217 157,331 1,235 3,054 72,946 1,001
Core 1,301,631 1,376,366 2,155 1,875,758 2,014,040 3,851 1,338,670 1,400,694 3,303
Non-Core 220,850 66,152 3,259 342,935 140,338 2,225 256,396 135,943 1,583
1,522,481 1,442,518 5,414 2,218,693 2,154,378 6,076 1,595,066 1,536,637 4,886
Reconciling item
RFS Holdings minority interest 174,005 159,337 296 182,959 166,776 174 245,763 212,766 675
1,696,486 1,601,855 5,710 2,401,652 2,321,154 6,250 1,840,829 1,749,403 5,561
Note:
(1) Segmental results for 2008 and 2007 have been restated to reflect transfers of businesses between segments in 2009.
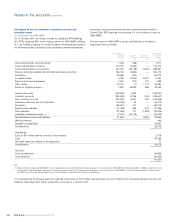
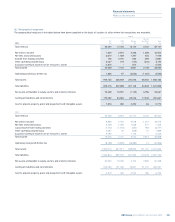
Segmental analysis of goodwill is as follows:
Reportable segments
RFS
Global Global US Holdings
UK UK Banking Transaction Ulster Retail & RBS Non- minority
Retail Corporate Wealth & Markets Services Bank Commercial Insurance Core interest Total
£m £m £m £m £m £m £m £m £m £m £m
At 1 January 2007 2,803 2,741 746 1,065 1,657 820 5,429 1,064 1,564 — 17,889
Currency translation and
other adjustments — — 7 137 18 38 (103) — 133 957 1,187
Acquisitions — — — 2,989 721 — 66 — 2,677 17,464 23,917
Goodwill written off ————— — ——(40) — (40)
At 1 January 2008 2,803 2,741 753 4,191 2,396 858 5,392 1,064 4,334 18.421 42,953
Transfers to disposal groups ————— — ———(3,692) (3,692)
Currency translation and
other adjustments — — 56 879 680 133 2,013 7 801 4,336 8,905
Acquisitions — — — 147 35 — — — 342 — 524
Disposals ————— — ——(49) (3,017) (3,066)
Write-down of goodwill — (46) (9) (5,179) (44) (991) (4,382) (42) (4,831) (14,538) (30,062)
At 1 January 2009 2,803 2,695 800 38 3,067 — 3,023 1,029 597 1,510 15,562
Transfers to disposal groups ————— — ——(238) — (238)
Currency translation
and other adjustments — — (12) (1) (233) — (302) (8) (34) (107) (697)
Write-down of goodwill ————— — —(66) (297) — (363)
At 31 December 2009 2,803 2,695 788 37 2,834 — 2,721 955 28 1,403 14,264