RBS 2009 Annual Report Download - page 279
Download and view the complete annual report
Please find page 279 of the 2009 RBS annual report below. You can navigate through the pages in the report by either clicking on the pages listed below, or by using the keyword search tool below to find specific information within the annual report.-
 1
1 -
2
-
3
-
4
-
5
-
6
-
7
-
8
-
9
-
10
-
11
-
12
-
13
-
14
-
15
-
16
-
17
-
18
-
19
-
20
-
21
-
22
-
23
-
24
-
25
-
26
-
27
-
28
-
29
-
30
-
31
-
32
-
33
-
34
-
35
-
36
-
37
-
38
-
39
-
40
-
41
-
42
-
43
-
44
-
45
-
46
-
47
-
48
-
49
-
50
-
51
-
52
-
53
-
54
-
55
-
56
-
57
-
58
-
59
-
60
-
61
-
62
-
63
-
64
-
65
-
66
-
67
-
68
-
69
-
70
-
71
-
72
-
73
-
74
-
75
-
76
-
77
-
78
-
79
-
80
-
81
-
82
-
83
-
84
-
85
-
86
-
87
-
88
-
89
-
90
-
91
-
92
-
93
-
94
-
95
-
96
-
97
-
98
-
99
-
100
-
101
-
102
-
103
-
104
-
105
-
106
-
107
-
108
-
109
-
110
-
111
-
112
-
113
-
114
-
115
-
116
-
117
-
118
-
119
-
120
-
121
-
122
-
123
-
124
-
125
-
126
-
127
-
128
-
129
-
130
-
131
-
132
-
133
-
134
-
135
-
136
-
137
-
138
-
139
-
140
-
141
-
142
-
143
-
144
-
145
-
146
-
147
-
148
-
149
-
150
-
151
-
152
-
153
-
154
-
155
-
156
-
157
-
158
-
159
-
160
-
161
-
162
-
163
-
164
-
165
-
166
-
167
-
168
-
169
-
170
-
171
-
172
-
173
-
174
-
175
-
176
-
177
-
178
-
179
-
180
-
181
-
182
-
183
-
184
-
185
-
186
-
187
-
188
-
189
-
190
-
191
-
192
-
193
-
194
-
195
-
196
-
197
-
198
-
199
-
200
-
201
-
202
-
203
-
204
-
205
-
206
-
207
-
208
-
209
-
210
-
211
-
212
-
213
-
214
-
215
-
216
-
217
-
218
-
219
-
220
-
221
-
222
-
223
-
224
-
225
-
226
-
227
-
228
-
229
-
230
-
231
-
232
-
233
-
234
-
235
-
236
-
237
-
238
-
239
-
240
-
241
-
242
-
243
-
244
-
245
-
246
-
247
-
248
-
249
-
250
-
251
-
252
-
253
-
254
-
255
-
256
-
257
-
258
-
259
-
260
-
261
-
262
-
263
-
264
-
265
-
266
-
267
-
268
-
 269
269 -
 270
270 -
 271
271 -
 272
272 -
 273
273 -
 274
274 -
 275
275 -
 276
276 -
 277
277 -
 278
278 -
 279
279 -
 280
280 -
 281
281 -
 282
282 -
 283
283 -
 284
284 -
 285
285 -
 286
286 -
 287
287 -
 288
288 -
 289
289 -
290
-
291
-
292
-
293
-
294
-
295
-
296
-
297
-
298
-
299
-
300
-
301
-
302
-
303
-
304
-
305
-
306
-
307
-
308
-
309
-
310
-
311
-
312
-
313
-
314
-
315
-
316
-
317
-
318
-
319
-
320
-
321
-
322
-
323
-
324
-
325
-
326
-
327
-
328
-
329
-
330
-
331
-
332
-
333
-
334
-
335
-
336
-
337
-
338
-
339
-
340
-
341
-
342
-
343
-
344
-
345
-
346
-
347
-
348
-
349
-
350
-
351
-
352
-
353
-
354
-
355
-
356
-
357
-
358
-
359
-
360
-
361
-
362
-
363
-
364
-
365
-
366
-
367
-
368
-
369
-
370
-
371
-
372
-
373
-
374
-
375
-
376
-
377
-
378
-
379
-
380
-
381
-
382
-
383
-
384
-
385
-
386
-
387
-
388
-
389
-
390
 |
 |

Financial statements
Notes on the accounts
277RBS Group Annual Report and Accounts 2009
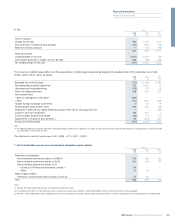
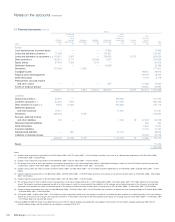
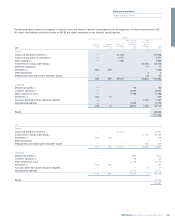
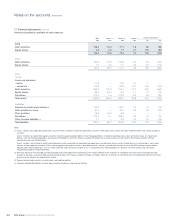
The following table is for reclassifications in 2008. The balance sheet values of these assets, the effect of the reclassification on the income statement
for the period from the date of reclassification to 31 December 2008 and the gains and losses relating to these assets recorded in the income
statement for the years ended 31 December 2008, 2007 and 2006 were as follows:
2008 2007 2006
After reclassification Gains/(losses)
2008 – on reclassification 31 December 2008 Gains/(losses) Increase in recognised in
up to the Amount profit or loss the income
Effective Expected date of that would as result of statement
Carrying interest cash Carrying Fair reclassi- Impairment have been reclassi- in prior
value rate flows value value fication Income losses recognised fication periods
£m %£m£m£m£m£m£m£m£m£m £m
Reclassified from HFT to LAR:
Loans
Leveraged finance 3,602 10.14% 6,091 4,304 2,714 (456) 455 — (1,015) 1,470 (155) —
Corporate and other loans 5,205 6.03% 7,752 6,053 5,143 (74) 267 — (639) 906 (46) 3
8,807 13,843 10,357 7,857 (530) 722 — (1,654) 2,376 (201) 3
Debt securities
CDO 215 4.92% 259 236 221 4 5 — (11) 16 5 6
RMBS 1,765 6.05% 2,136 2,059 1,579 (115) 171 — (293) 464 (12) —
CMBS 1,877 4.77% 2,402 2,144 1,776 (42) 50 — (293) 343 (19) —
CLOs 835 6.34% 1,141 1,121 851 (22) 104 — (164) 268 (14) (2)
Other ABS 2,203 5.07% 3,203 2,242 1,943 (68) 129 — (151) 280 3 (1)
Other 2,548 2.64% 2,778 2,615 2,401 73 7 — (162) 169 95 476
9,443 11,919 10,417 8,771 (170) 466 — (1,074) 1,540 58 479
Total 18,250 25,762 20,774 16,628 (700) 1,188 — (2,728) 3,916 (143) 482
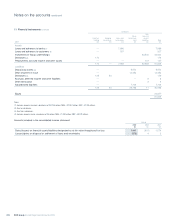
Reclassified from HFT to AFS:
Debt securities (1)
CDO 3,592 10.32% 5,607 1,346 1,346 (994) (514) (446) (1,468) 508 (400) —
RMBS 5,205 8.03% 8,890 5,171 5,171 (531) 21 — (131) 152 (4) 74
CMBS 590 6.65% 836 256 256 (110) (48) — (408) 360 4 —
CLOs 3,498 4.89% 4,257 3,759 3,759 (353) (797) — (1,633) 836 36 1
Other ABS 1,323 5.70% 2,013 712 712 (185) (36) — (5) (31) (42) 72
Other 756 10.17% 1,311 777 777 — 131 — (3) 134 (1) —
14,964 22,914 12,021 12,021 (2,173) (1,243) (446) (3,648) 1,959 (407) 147
Equity shares 34 — 32 26 26 (9) — — (9) 9 13 —
14,998 22,946 12,047 12,047 (2,182) (1,243) (446) (3,657) 1,968 (394) 147
Reclassified from
AFS to LAR:
Debt securities (1) 694 1.38% 760 1,016 956 (12) 6 — 6 — — —
Total 33,942 49,468 33,837 29,631 (2,894) (49) (446) (6,379) 5,884 (537) 629
Notes:
(1) The amount taken to AFS reserves was £(2,193) million.
(2) The amount that would have been in AFS reserves if reclassification had not occurred is £(37) million.
(3) The above table has been restated.