RBS 2009 Annual Report Download - page 322
Download and view the complete annual report
Please find page 322 of the 2009 RBS annual report below. You can navigate through the pages in the report by either clicking on the pages listed below, or by using the keyword search tool below to find specific information within the annual report.-
 1
1 -
2
-
3
-
4
-
5
-
6
-
7
-
8
-
9
-
10
-
11
-
12
-
13
-
14
-
15
-
16
-
17
-
18
-
19
-
20
-
21
-
22
-
23
-
24
-
25
-
26
-
27
-
28
-
29
-
30
-
31
-
32
-
33
-
34
-
35
-
36
-
37
-
38
-
39
-
40
-
41
-
42
-
43
-
44
-
45
-
46
-
47
-
48
-
49
-
50
-
51
-
52
-
53
-
54
-
55
-
56
-
57
-
58
-
59
-
60
-
61
-
62
-
63
-
64
-
65
-
66
-
67
-
68
-
69
-
70
-
71
-
72
-
73
-
74
-
75
-
76
-
77
-
78
-
79
-
80
-
81
-
82
-
83
-
84
-
85
-
86
-
87
-
88
-
89
-
90
-
91
-
92
-
93
-
94
-
95
-
96
-
97
-
98
-
99
-
100
-
101
-
102
-
103
-
104
-
105
-
106
-
107
-
108
-
109
-
110
-
111
-
112
-
113
-
114
-
115
-
116
-
117
-
118
-
119
-
120
-
121
-
122
-
123
-
124
-
125
-
126
-
127
-
128
-
129
-
130
-
131
-
132
-
133
-
134
-
135
-
136
-
137
-
138
-
139
-
140
-
141
-
142
-
143
-
144
-
145
-
146
-
147
-
148
-
149
-
150
-
151
-
152
-
153
-
154
-
155
-
156
-
157
-
158
-
159
-
160
-
161
-
162
-
163
-
164
-
165
-
166
-
167
-
168
-
169
-
170
-
171
-
172
-
173
-
174
-
175
-
176
-
177
-
178
-
179
-
180
-
181
-
182
-
183
-
184
-
185
-
186
-
187
-
188
-
189
-
190
-
191
-
192
-
193
-
194
-
195
-
196
-
197
-
198
-
199
-
200
-
201
-
202
-
203
-
204
-
205
-
206
-
207
-
208
-
209
-
210
-
211
-
212
-
213
-
214
-
215
-
216
-
217
-
218
-
219
-
220
-
221
-
222
-
223
-
224
-
225
-
226
-
227
-
228
-
229
-
230
-
231
-
232
-
233
-
234
-
235
-
236
-
237
-
238
-
239
-
240
-
241
-
242
-
243
-
244
-
245
-
246
-
247
-
248
-
249
-
250
-
251
-
252
-
253
-
254
-
255
-
256
-
257
-
258
-
259
-
260
-
261
-
262
-
263
-
264
-
265
-
266
-
267
-
268
-
269
-
270
-
271
-
272
-
273
-
274
-
275
-
276
-
277
-
278
-
279
-
280
-
281
-
282
-
283
-
284
-
285
-
286
-
287
-
288
-
289
-
290
-
291
-
292
-
293
-
294
-
295
-
296
-
297
-
298
-
299
-
300
-
301
-
302
-
303
-
304
-
305
-
306
-
307
-
308
-
309
-
310
-
311
-
 312
312 -
 313
313 -
 314
314 -
 315
315 -
 316
316 -
 317
317 -
 318
318 -
 319
319 -
 320
320 -
 321
321 -
 322
322 -
 323
323 -
 324
324 -
 325
325 -
 326
326 -
 327
327 -
 328
328 -
 329
329 -
 330
330 -
 331
331 -
 332
332 -
333
-
334
-
335
-
336
-
337
-
338
-
339
-
340
-
341
-
342
-
343
-
344
-
345
-
346
-
347
-
348
-
349
-
350
-
351
-
352
-
353
-
354
-
355
-
356
-
357
-
358
-
359
-
360
-
361
-
362
-
363
-
364
-
365
-
366
-
367
-
368
-
369
-
370
-
371
-
372
-
373
-
374
-
375
-
376
-
377
-
378
-
379
-
380
-
381
-
382
-
383
-
384
-
385
-
386
-
387
-
388
-
389
-
390
 |
 |

RBS Group Annual Report and Accounts 2009320
Notes on the accounts continued
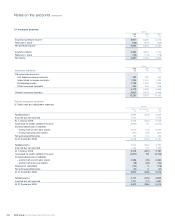
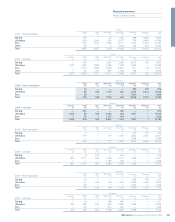
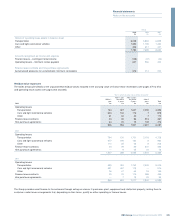
25 Subordinated liabilities continued
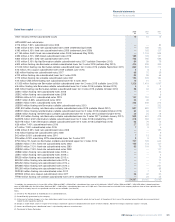
Dated loan capital 2009 2008 2007
£m £m £m
The company
US$400 million 6.4% subordinated notes 2009 (redeemed April 2009) — 278 202
US$300 million 6.375% subordinated notes 2011 (1) 201 231 163
US$750 million 5% subordinated notes 2013 (1) 503 579 382
US$750 million 5% subordinated notes 2014 (1) 521 616 386
US$250 million 5% subordinated notes 2014 (1) 153 169 123
US$675 million 5.05% subordinated notes 2015 (1) 468 550 357
US$350 million 4.7% subordinated notes 2018 (1) 231 286 173
2,077* 2,709* 1,786*
The Royal Bank of Scotland plc
255 million 5.25% subordinated notes 2008 —— 192
300 million 4.875% subordinated notes 2009 (redeemed March 2009) — 298 228
1,000 million 6% subordinated notes 2013 1,014 1,083 790
US$50 million floating rate subordinated notes 2013 36 36 26
1,000 million floating rate subordinated notes 2013 — — 744
500 million 6% subordinated notes 2013 452 487 374
£150 million 10.5% subordinated bonds 2013 (2) 177 180 169
US$1,250 million floating rate subordinated notes 2014 (redeemed July 2009) — 862 630
AUD590 million 6% subordinated notes 2014 (callable April 2010) 330 281 254
AUD410 million floating rate subordinated notes 2014 (callable April 2010) 229 195 182
CAD700 million 4.25% subordinated notes 2015 (callable March 2010) 419 409 358
£250 million 9.625% subordinated bonds 2015 301 311 286
US$750 million floating rate subordinated notes 2015 (callable September 2010) 462 513 374
750 million floating rate subordinated notes 2015 741 783 564
CHF400 million 2.375% subordinated notes 2015 244 257 166
CHF100 million 2.375% subordinated notes 2015 69 72 41
CHF200 million 2.375% subordinated notes 2015 117 125 86
US$500 million floating rate subordinated notes 2016 (callable October 2011) 308 346 252
US$1,500 million floating rate subordinated notes 2016 (callable April 2011) 926 1,038 757
500 million 4.5% subordinated notes 2016 (callable January 2011) 476 511 379
CHF200 million 2.75% subordinated notes 2017 (callable December 2012) 120 129 89
100 million floating rate subordinated notes 2017 89 97 73
500 million floating rate subordinated notes 2017 (callable June 2012) 445 482 371
750 million 4.35% subordinated notes 2017 (callable January 2017) 728 770 548
AUD450 million 6.5% subordinated notes 2017 (callable February 2012) 255 217 202
AUD450 million floating rate subordinated notes 2017 (callable February 2012) 250 214 199
US$1,500 million floating rate subordinated callable step up
notes 2017 (callable August 2012) 925 1,029 752
2,000 million 6.93% subordinated notes 2018 (callable April 2018) 2,017 2,136 —
US$125.6 million floating rate subordinated notes 2020 78 87 64
1,000 million 4.625% subordinated notes 2021 (callable September 2016) 962 1,019 724
300 million CMS linked floating rate subordinated notes 2022 292 303 228
144.4 million floating rate subordinated notes 2022 (callable June 2022) 143 152 —
National Westminster Bank Plc
US$1,000 million 7.375% subordinated notes 2009 (redeemed October 2009) — 697 507
600 million 6% subordinated notes 2010 564 623 474
500 million 5.125% subordinated notes 2011 455 488 376
£300 million 7.875% subordinated notes 2015 365 379 349
£300 million 6.5% subordinated notes 2021 351 376 330
Charter One Financial, Inc.
US$400 million 6.375% subordinated notes 2012 255 287 212
RBS Holdings USA Inc.
US$170 million subordinated loan capital floating rate notes 2009 (redeemed October 2009) — 116 85
US$100 million 5.575% senior subordinated revolving credit 2009 (redeemed October 2009) — 69 50
US$500 million subordinated loan capital floating rate notes 2010 (callable on any interest payment date) 311 342 249
First Active plc
£60 million 6.375% subordinated bonds 2018 (callable April 2013) 66 66 65