RBS 2009 Annual Report Download - page 331
Download and view the complete annual report
Please find page 331 of the 2009 RBS annual report below. You can navigate through the pages in the report by either clicking on the pages listed below, or by using the keyword search tool below to find specific information within the annual report.-
 1
1 -
2
-
3
-
4
-
5
-
6
-
7
-
8
-
9
-
10
-
11
-
12
-
13
-
14
-
15
-
16
-
17
-
18
-
19
-
20
-
21
-
22
-
23
-
24
-
25
-
26
-
27
-
28
-
29
-
30
-
31
-
32
-
33
-
34
-
35
-
36
-
37
-
38
-
39
-
40
-
41
-
42
-
43
-
44
-
45
-
46
-
47
-
48
-
49
-
50
-
51
-
52
-
53
-
54
-
55
-
56
-
57
-
58
-
59
-
60
-
61
-
62
-
63
-
64
-
65
-
66
-
67
-
68
-
69
-
70
-
71
-
72
-
73
-
74
-
75
-
76
-
77
-
78
-
79
-
80
-
81
-
82
-
83
-
84
-
85
-
86
-
87
-
88
-
89
-
90
-
91
-
92
-
93
-
94
-
95
-
96
-
97
-
98
-
99
-
100
-
101
-
102
-
103
-
104
-
105
-
106
-
107
-
108
-
109
-
110
-
111
-
112
-
113
-
114
-
115
-
116
-
117
-
118
-
119
-
120
-
121
-
122
-
123
-
124
-
125
-
126
-
127
-
128
-
129
-
130
-
131
-
132
-
133
-
134
-
135
-
136
-
137
-
138
-
139
-
140
-
141
-
142
-
143
-
144
-
145
-
146
-
147
-
148
-
149
-
150
-
151
-
152
-
153
-
154
-
155
-
156
-
157
-
158
-
159
-
160
-
161
-
162
-
163
-
164
-
165
-
166
-
167
-
168
-
169
-
170
-
171
-
172
-
173
-
174
-
175
-
176
-
177
-
178
-
179
-
180
-
181
-
182
-
183
-
184
-
185
-
186
-
187
-
188
-
189
-
190
-
191
-
192
-
193
-
194
-
195
-
196
-
197
-
198
-
199
-
200
-
201
-
202
-
203
-
204
-
205
-
206
-
207
-
208
-
209
-
210
-
211
-
212
-
213
-
214
-
215
-
216
-
217
-
218
-
219
-
220
-
221
-
222
-
223
-
224
-
225
-
226
-
227
-
228
-
229
-
230
-
231
-
232
-
233
-
234
-
235
-
236
-
237
-
238
-
239
-
240
-
241
-
242
-
243
-
244
-
245
-
246
-
247
-
248
-
249
-
250
-
251
-
252
-
253
-
254
-
255
-
256
-
257
-
258
-
259
-
260
-
261
-
262
-
263
-
264
-
265
-
266
-
267
-
268
-
269
-
270
-
271
-
272
-
273
-
274
-
275
-
276
-
277
-
278
-
279
-
280
-
281
-
282
-
283
-
284
-
285
-
286
-
287
-
288
-
289
-
290
-
291
-
292
-
293
-
294
-
295
-
296
-
297
-
298
-
299
-
300
-
301
-
302
-
303
-
304
-
305
-
306
-
307
-
308
-
309
-
310
-
311
-
312
-
313
-
314
-
315
-
316
-
317
-
318
-
319
-
320
-
 321
321 -
 322
322 -
 323
323 -
 324
324 -
 325
325 -
 326
326 -
 327
327 -
 328
328 -
 329
329 -
 330
330 -
 331
331 -
 332
332 -
 333
333 -
 334
334 -
 335
335 -
 336
336 -
 337
337 -
 338
338 -
 339
339 -
 340
340 -
 341
341 -
342
-
343
-
344
-
345
-
346
-
347
-
348
-
349
-
350
-
351
-
352
-
353
-
354
-
355
-
356
-
357
-
358
-
359
-
360
-
361
-
362
-
363
-
364
-
365
-
366
-
367
-
368
-
369
-
370
-
371
-
372
-
373
-
374
-
375
-
376
-
377
-
378
-
379
-
380
-
381
-
382
-
383
-
384
-
385
-
386
-
387
-
388
-
389
-
390
 |
 |

329RBS Group Annual Report and Accounts 2009
Financial statements
Notes on the accounts
Group
2009 2008 2007
£m £m £m
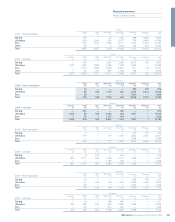
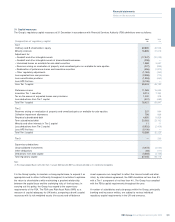
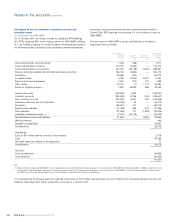
Nature of operating lease assets in balance sheet
Transportation 6,039 5,883 6,859
Cars and light commercial vehicles 1,352 1,199 1,390
Other 403 617 441
7,794 7,699 8,690
Amounts recognised as income and expense
Finance leases – contingent rental income (139) (37) (23)
Operating leases – minimum rentals payable 647 566 322
Finance lease contracts and hire purchase agreements
Accumulated allowance for uncollectable minimum receivables 313 213 222
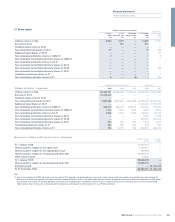
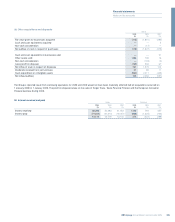
Residual value exposures
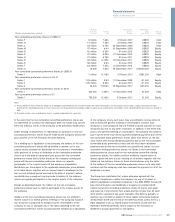
The tables below give details of the unguaranteed residual values included in the carrying value of finance lease receivables (see pages 270 to 272)
and operating lease assets (see pages 304 and 305).
Year in which residual value will be recovered
After 1 year After 2 years
Within 1 but within but within After 5
year 2 years 5 years years Total
2009 £m £m £m £m £m
Operating leases
Transportation 164 327 1,607 2,255 4,353
Cars and light commercial vehicles 624 134 113 7 878
Other 31 32 40 7 110
Finance lease contracts 23 35 96 313 467
Hire purchase agreements 64 25 75 109 273
906 553 1,931 2,691 6,081
2008
Operating leases
Transportation 794 130 1,701 2,103 4,728
Cars and light commercial vehicles 577 195 182 8 962
Other 112 35 48 8 203
Finance lease contracts 24 29 99 341 493
Hire purchase agreements — 9 25 44 78
1,507 398 2,055 2,504 6,464
2007
Operating leases
Transportation 485 253 1,762 2,505 5,005
Cars and light commercial vehicles 331 467 118 — 916
Other 26 47 64 18 155
Finance lease contracts 23 29 115 288 455
Hire purchase agreements — 7 18 29 54
865 803 2,077 2,840 6,585
The Group provides asset finance to its customers through acting as a lessor. It purchases plant, equipment and intellectual property, renting them to
customers under lease arrangements that, depending on their terms, qualify as either operating or finance leases.