RBS 2009 Annual Report Download - page 283
Download and view the complete annual report
Please find page 283 of the 2009 RBS annual report below. You can navigate through the pages in the report by either clicking on the pages listed below, or by using the keyword search tool below to find specific information within the annual report.-
 1
1 -
2
-
3
-
4
-
5
-
6
-
7
-
8
-
9
-
10
-
11
-
12
-
13
-
14
-
15
-
16
-
17
-
18
-
19
-
20
-
21
-
22
-
23
-
24
-
25
-
26
-
27
-
28
-
29
-
30
-
31
-
32
-
33
-
34
-
35
-
36
-
37
-
38
-
39
-
40
-
41
-
42
-
43
-
44
-
45
-
46
-
47
-
48
-
49
-
50
-
51
-
52
-
53
-
54
-
55
-
56
-
57
-
58
-
59
-
60
-
61
-
62
-
63
-
64
-
65
-
66
-
67
-
68
-
69
-
70
-
71
-
72
-
73
-
74
-
75
-
76
-
77
-
78
-
79
-
80
-
81
-
82
-
83
-
84
-
85
-
86
-
87
-
88
-
89
-
90
-
91
-
92
-
93
-
94
-
95
-
96
-
97
-
98
-
99
-
100
-
101
-
102
-
103
-
104
-
105
-
106
-
107
-
108
-
109
-
110
-
111
-
112
-
113
-
114
-
115
-
116
-
117
-
118
-
119
-
120
-
121
-
122
-
123
-
124
-
125
-
126
-
127
-
128
-
129
-
130
-
131
-
132
-
133
-
134
-
135
-
136
-
137
-
138
-
139
-
140
-
141
-
142
-
143
-
144
-
145
-
146
-
147
-
148
-
149
-
150
-
151
-
152
-
153
-
154
-
155
-
156
-
157
-
158
-
159
-
160
-
161
-
162
-
163
-
164
-
165
-
166
-
167
-
168
-
169
-
170
-
171
-
172
-
173
-
174
-
175
-
176
-
177
-
178
-
179
-
180
-
181
-
182
-
183
-
184
-
185
-
186
-
187
-
188
-
189
-
190
-
191
-
192
-
193
-
194
-
195
-
196
-
197
-
198
-
199
-
200
-
201
-
202
-
203
-
204
-
205
-
206
-
207
-
208
-
209
-
210
-
211
-
212
-
213
-
214
-
215
-
216
-
217
-
218
-
219
-
220
-
221
-
222
-
223
-
224
-
225
-
226
-
227
-
228
-
229
-
230
-
231
-
232
-
233
-
234
-
235
-
236
-
237
-
238
-
239
-
240
-
241
-
242
-
243
-
244
-
245
-
246
-
247
-
248
-
249
-
250
-
251
-
252
-
253
-
254
-
255
-
256
-
257
-
258
-
259
-
260
-
261
-
262
-
263
-
264
-
265
-
266
-
267
-
268
-
269
-
270
-
271
-
272
-
 273
273 -
 274
274 -
 275
275 -
 276
276 -
 277
277 -
 278
278 -
 279
279 -
 280
280 -
 281
281 -
 282
282 -
 283
283 -
 284
284 -
 285
285 -
 286
286 -
 287
287 -
 288
288 -
 289
289 -
 290
290 -
 291
291 -
 292
292 -
 293
293 -
294
-
295
-
296
-
297
-
298
-
299
-
300
-
301
-
302
-
303
-
304
-
305
-
306
-
307
-
308
-
309
-
310
-
311
-
312
-
313
-
314
-
315
-
316
-
317
-
318
-
319
-
320
-
321
-
322
-
323
-
324
-
325
-
326
-
327
-
328
-
329
-
330
-
331
-
332
-
333
-
334
-
335
-
336
-
337
-
338
-
339
-
340
-
341
-
342
-
343
-
344
-
345
-
346
-
347
-
348
-
349
-
350
-
351
-
352
-
353
-
354
-
355
-
356
-
357
-
358
-
359
-
360
-
361
-
362
-
363
-
364
-
365
-
366
-
367
-
368
-
369
-
370
-
371
-
372
-
373
-
374
-
375
-
376
-
377
-
378
-
379
-
380
-
381
-
382
-
383
-
384
-
385
-
386
-
387
-
388
-
389
-
390
 |
 |

Financial statements
Notes on the accounts
281RBS Group Annual Report and Accounts 2009
Own credit
When valuing financial liabilities recorded at fair value, the Group takes
into account the effect of its own credit standing. The categories of
financial liabilities on which own credit spread adjustments are made
are issued debt held at fair value, including issued structured notes, and
derivatives. An own credit adjustment is applied to positions where it is
believed that counterparties would consider the Group’s
creditworthiness when pricing trades.
For issued debt and structured notes, this adjustment is based on
independent quotes from market participants for the debt issuance
spreads above average inter-bank rates, (at a range of tenors) which
the market would demand when purchasing new senior or sub-debt
issuances from the Group. Where necessary, these quotes are
interpolated using a curve shape derived from CDS prices.
The own credit adjustment:
•does not alter cash flows;
•is not used for performance management; and
•is disregarded for regulatory capital reporting processes.
The fair value of the Group’s derivative financial liabilities has also been
adjusted to reflect the Group’s own credit risk. The adjustment takes into
account collateral posted by the Group and the effects of master
netting agreements.
The reserve movement between periods will not equate to the reported
profit or loss for own credit. The balance sheet reserves are stated by
conversion of underlying currency balances at spot rates for each
period whereas the income statement includes intra-period foreign
exchange sell-offs.
The effect of change in credit spreads could be reversed in future
periods.
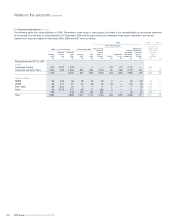
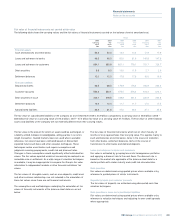
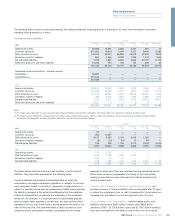
The table below shows own credit adjustments on own liabilities.
Debt securities in issue
Designated
as at
fair value
Held-for- through profit
trading (1) or loss Total Derivatives (2) Total
Cumulative own credit adjustment £m £m £m £m £m
At 31 December 2009 1,237 1,094 2,331 467 2,798
At 31 December 2008 1,346 1,027 2,373 450 2,823
At 31 December 2007 304 152 456 — 456
Book values of underlying liabilities £bn £bn £bn £bn £bn
At 31 December 2009 36.6 13.3 49.9 16.8 66.7
At 31 December 2008 25.5 16.9 42.4 43.5 85.9
Notes:
(1) The held-for-trading portfolio consists of wholesale and retail note issuances.
(2) The effect of foreign exchange rates, new issues and redemptions are not captured separately.