RBS 2009 Annual Report Download - page 325
Download and view the complete annual report
Please find page 325 of the 2009 RBS annual report below. You can navigate through the pages in the report by either clicking on the pages listed below, or by using the keyword search tool below to find specific information within the annual report.-
 1
1 -
2
-
3
-
4
-
5
-
6
-
7
-
8
-
9
-
10
-
11
-
12
-
13
-
14
-
15
-
16
-
17
-
18
-
19
-
20
-
21
-
22
-
23
-
24
-
25
-
26
-
27
-
28
-
29
-
30
-
31
-
32
-
33
-
34
-
35
-
36
-
37
-
38
-
39
-
40
-
41
-
42
-
43
-
44
-
45
-
46
-
47
-
48
-
49
-
50
-
51
-
52
-
53
-
54
-
55
-
56
-
57
-
58
-
59
-
60
-
61
-
62
-
63
-
64
-
65
-
66
-
67
-
68
-
69
-
70
-
71
-
72
-
73
-
74
-
75
-
76
-
77
-
78
-
79
-
80
-
81
-
82
-
83
-
84
-
85
-
86
-
87
-
88
-
89
-
90
-
91
-
92
-
93
-
94
-
95
-
96
-
97
-
98
-
99
-
100
-
101
-
102
-
103
-
104
-
105
-
106
-
107
-
108
-
109
-
110
-
111
-
112
-
113
-
114
-
115
-
116
-
117
-
118
-
119
-
120
-
121
-
122
-
123
-
124
-
125
-
126
-
127
-
128
-
129
-
130
-
131
-
132
-
133
-
134
-
135
-
136
-
137
-
138
-
139
-
140
-
141
-
142
-
143
-
144
-
145
-
146
-
147
-
148
-
149
-
150
-
151
-
152
-
153
-
154
-
155
-
156
-
157
-
158
-
159
-
160
-
161
-
162
-
163
-
164
-
165
-
166
-
167
-
168
-
169
-
170
-
171
-
172
-
173
-
174
-
175
-
176
-
177
-
178
-
179
-
180
-
181
-
182
-
183
-
184
-
185
-
186
-
187
-
188
-
189
-
190
-
191
-
192
-
193
-
194
-
195
-
196
-
197
-
198
-
199
-
200
-
201
-
202
-
203
-
204
-
205
-
206
-
207
-
208
-
209
-
210
-
211
-
212
-
213
-
214
-
215
-
216
-
217
-
218
-
219
-
220
-
221
-
222
-
223
-
224
-
225
-
226
-
227
-
228
-
229
-
230
-
231
-
232
-
233
-
234
-
235
-
236
-
237
-
238
-
239
-
240
-
241
-
242
-
243
-
244
-
245
-
246
-
247
-
248
-
249
-
250
-
251
-
252
-
253
-
254
-
255
-
256
-
257
-
258
-
259
-
260
-
261
-
262
-
263
-
264
-
265
-
266
-
267
-
268
-
269
-
270
-
271
-
272
-
273
-
274
-
275
-
276
-
277
-
278
-
279
-
280
-
281
-
282
-
283
-
284
-
285
-
286
-
287
-
288
-
289
-
290
-
291
-
292
-
293
-
294
-
295
-
296
-
297
-
298
-
299
-
300
-
301
-
302
-
303
-
304
-
305
-
306
-
307
-
308
-
309
-
310
-
311
-
312
-
313
-
314
-
 315
315 -
 316
316 -
 317
317 -
 318
318 -
 319
319 -
 320
320 -
 321
321 -
 322
322 -
 323
323 -
 324
324 -
 325
325 -
 326
326 -
 327
327 -
 328
328 -
 329
329 -
 330
330 -
 331
331 -
 332
332 -
 333
333 -
 334
334 -
 335
335 -
336
-
337
-
338
-
339
-
340
-
341
-
342
-
343
-
344
-
345
-
346
-
347
-
348
-
349
-
350
-
351
-
352
-
353
-
354
-
355
-
356
-
357
-
358
-
359
-
360
-
361
-
362
-
363
-
364
-
365
-
366
-
367
-
368
-
369
-
370
-
371
-
372
-
373
-
374
-
375
-
376
-
377
-
378
-
379
-
380
-
381
-
382
-
383
-
384
-
385
-
386
-
387
-
388
-
389
-
390
 |
 |

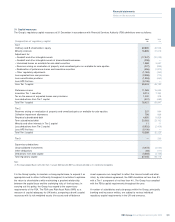
323RBS Group Annual Report and Accounts 2009
Financial statements
Notes on the accounts
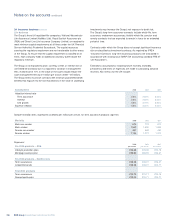
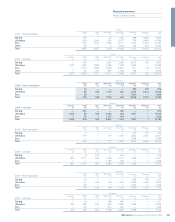
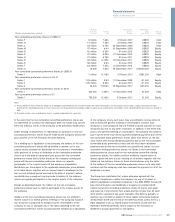
Preference shares 2009 2008 2007
£m £m £m
The company
Non-cumulative preference shares of US$0.01 (1)
Series F US$200 million 7.65% (redeemable at option of issuer) 123 137 100
Series H US$300 million 7.25% (redeemable at option of issuer) 185 205 150
Series L US$850 million 5.75% (redeemable December 2049) 524 582 421
Non-cumulative convertible preference shares of US$0.01 (1)
Series 1 US$1,000 million 9.118% (redeemable March 2010) 630 698 510
Non-cumulative convertible preference shares of £0.01 (1)
Series 1 £200 million 7.387% (redeemable December 2010) 199 211 201
Cumulative preference shares of £1
£0.5 million 11% and £0.4 million 5.5% (non-redeemable) 1 11
1,662 1,834 1,383
National Westminster Bank Plc
Non-cumulative preference shares of £1
Series A £140 million 9% (non-redeemable) 145 145 143
Non-cumulative preference shares of US$25
Series C US$300 million 7.7628% (2) 193 215 160
2,000 2,194 1,686
Notes:
(1) Further details of the contractual terms of the preference shares are given in Note 27 on pages 326 and 327.
(2) Series C preference shares each carry a gross dividend of 8.625% inclusive of associated tax credit. Redeemable at the option of the issuer at par.
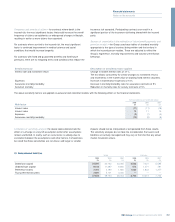
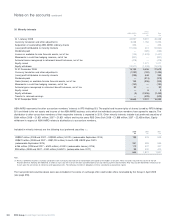
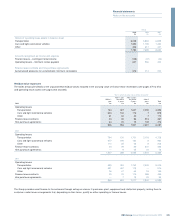
Trust preferred securities 2009 2008 2007
£m £m £m
391m (2008 and 2007 – 1250) 6.467% (redeemable June 2012) (1, 2) 362 1,325 979
US$486m (2008 and 2007 – US$750) 6.8% (redeemable December 2049) (1, 2) 300 514 374
US$322m (2008 and 2007 – US$850) 4.709% (redeemable July 2013) (1, 2) 196 640 421
US$394m (2008 and 2007 – US$650) 6.425% (redeemable January 2034) (1, 2) 280 677 344
ABN AMRO and subsidiaries
US$1,285 million 5.90% Trust Preferred V 696 760 464
US$200 million 6.25% Trust Preferred VI 107 121 82
US$1,800 million 6.08% Trust Preferred VII 950 1,064 762
2,891 5,101 3,426
Notes:
(1) The trust preferred securities issued by subsidiaries have no maturity date and are not redeemable at the option of the holders at any time. These securities may, with the consent of the UK
Financial Services Authority, be redeemed, by the issuer on the dates specified above or on any interest payment date thereafter. They may also be redeemed in whole, but not in part, upon the
occurrence of certain tax and regulatory events. The company classifies its obligations to these subsidiaries as dated loan capital.
(2) Partially redeemed following the completion of the exchange and tender offers in April 2009.